


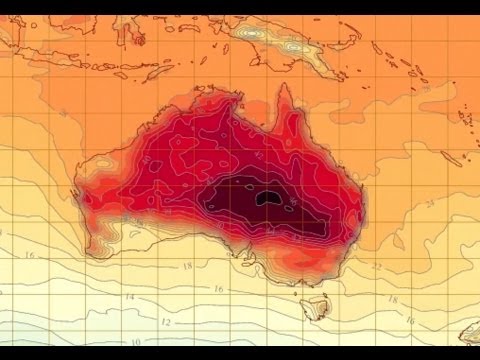
It’s so hot that the government weather agency added two new colors — deep purple and pink — to temperature charts to convey the new record highs being measured in the worst heat wave ever recorded down under, as The Age newspaper reported today.
For the moment, while extreme and widespread heat is predicted to persist, the country looks to be avoiding the new purple zone. Here’s an animation of the national heat forecast through the weekend:
In its coverage of the heat wave, The Age cited a government scientist who effectively conveyed the role of global warming from the buildup up of human-generated greenhouse gases:
‘‘The current heatwave – in terms of its duration, its intensity and its extent – is now unprecedented in our records,’’ the Bureau of Meteorology’s manager of climate monitoring and prediction, David Jones, said. ‘‘Clearly, the climate system is responding to the background warming trend. Everything that happens in the climate system now is taking place on a planet which is a degree hotter than it used to be.’’
As the warming trend increases over coming years, record-breaking heat will become more and more common, Dr. Jones said. ‘‘We know that global climate doesn’t respond monotonically – it does go up and down with natural variation. That’s why some years are hotter than others because of a range of factors. But we’re getting many more hot records than we’re getting cold records. That’s not an issue that is explained away by natural variation.’’ [Read the rest.]
My hat tip for these developments goes to Jeff Masters at Wunderground and Joe Romm at Climate Progress.
On Monday, Christopher C. Burt of Wunderground noted that the global conditions are very varied: “Record January Warmth in France and Australia while Record Cold in China and India Persists.” [ Jan. 11, 7:51 a.m. | Updated | The Times has run a global rundown of extreme conditions, hot and cold, around the planet.]
Not all extremes are equal. The extent of the impact of global warming on severe floods, hurricanes and other extreme meteorological phenomena remains murky, as the Intergovernmental Panel on Climate Change explained in its special report on extremes.
But for epic heat, things are much clearer. (See “More Record Highs and Far Fewer Lows” for more.)
In case you missed it, the National Oceanic and Atmospheric Administration issued its review of climate conditions in the United States in 2012. Here’s the introduction and a link to the rest:
2012 marked the warmest year on record for the contiguous United States with the year consisting of a record warm spring, second warmest summer, fourth warmest winter and a warmer-than-average autumn. The average temperature for 2012 was 55.3°F, 3.2°F above the 20th century average, and 1.0°F above 1998, the previous warmest year.
The average precipitation total for the contiguous U.S. for 2012 was 26.57 inches, 2.57 inches below average, making it the 15th driest year on record for the nation. At its peak in July, the drought of 2012 engulfed 61 percent of the nation with the Mountain West, Great Plains, and Midwest experiencing the most intense drought conditions. The dry conditions proved ideal for wildfires in the West, charring 9.2 million acres — the third highest on record. [Read on.]