 Print
PrintNimit Agarwal is an analyst and Yannick Ouaknine is Head of Sustainability Research at Société Générale S.A. The following post is based on a SG memorandum by Mr. Agarwal, Mr. Ouaknine, Aiswarya Sankar, Lorna Lucet, and Virgile Haddad. Related research from the Program on Corporate Governance includes Socially Responsible Firms by Alan Ferrell, Hao Liang, and Luc Renneboog (discussed on the Forum here).
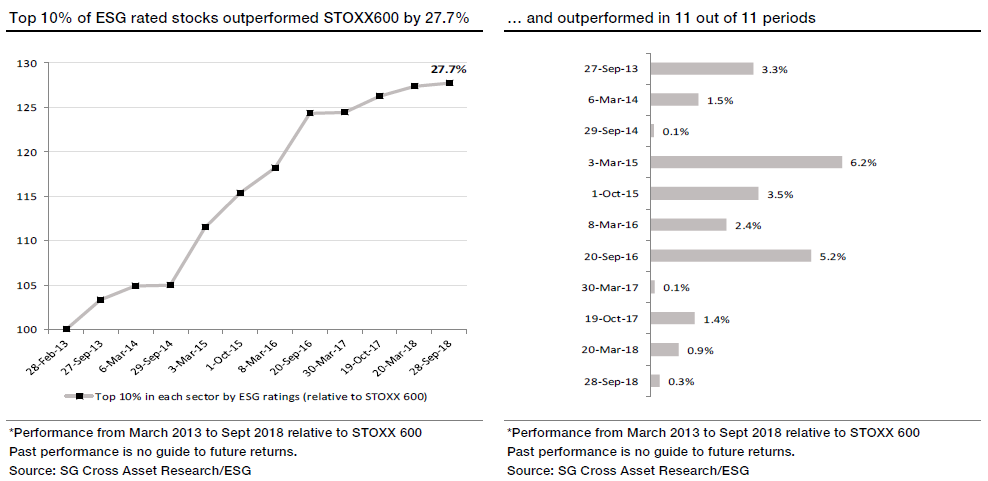
Traditionally, asset managers have used Environmental, Social and Governance ratings in a defensive way to mitigate portfolio risk, but the model ESG portfolio we have run over the past five years has consistently outperformed the index (and by 27.7% over the full period). Also note that the top rated 10% of our ESG stocks outperformed in all 11 of the 11 semi-annual periods since it was launched. So clearly ESG may not just be for defensive purposes. In this post we go one step further to see whether companies that are improving their ESG ratings also outperform. We found that not only do they outperform the index, they also outperformed our portfolio.
Since launching our model ESG portfolio in 2013 we have rebalanced it twice a year using raw data from Sustainalytics. We found that the top 10% of stocks with good ESG ratings outperformed the benchmark (STOXX600) over the five years from March 2013 to March 2018 by 27.7%. In this post, we go one step further to examine this phenomenon of improving ESG ratings (positive ESG momentum).
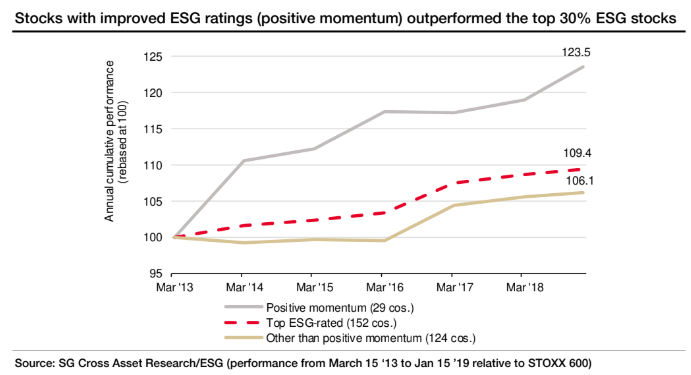
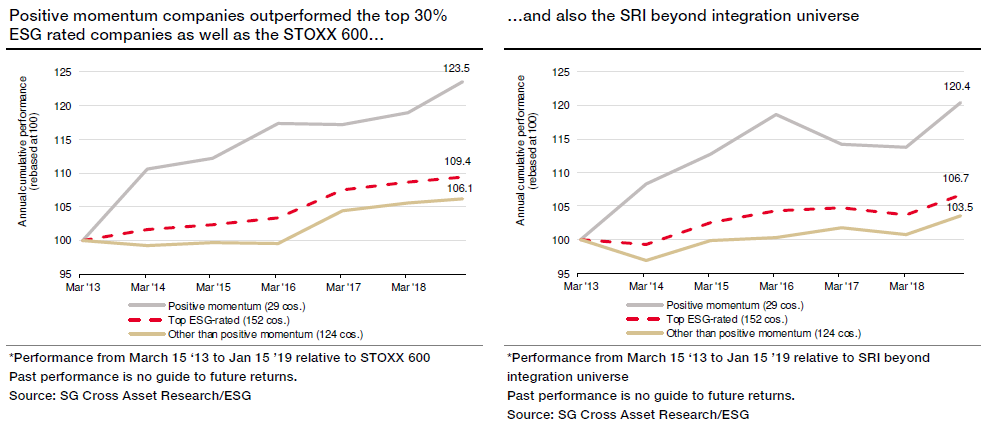
To this end we expanded the scope of analysis from the top 10% to the top 30% of our “SRI beyond integration” basket for each sector (hence to approx. 150 stocks). From this we found ca. 30 names that enjoyed positive momentum on their ESG ratings generated a cumulative outperformance of 23.5% vs the STOXX600 from Mar 2013 to Jan 2019. This is much higher than the outperformance of the top 30% ESG rated stocks from each sector (+9.4%), or that of negative-/neutral-momentum ESG stocks (+6.1%).
In summary
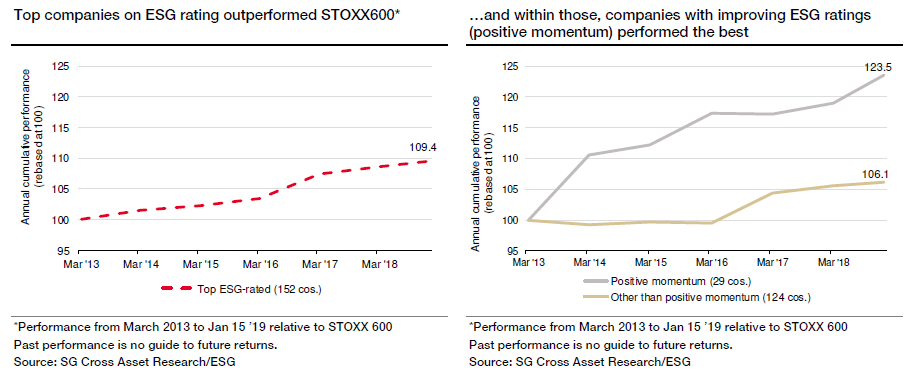
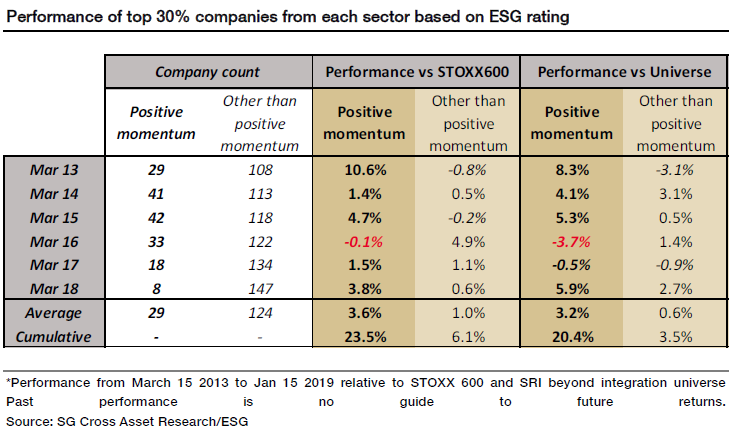
As we show below, based on our “SRI Beyond Integration Universe” of stocks, an investor who bought the top 30% ESG rated companies would have outperformed the STOXX600 over our performance period by more than 9%. However, if they had bought the positive-ESG-momentum companies, i.e. those that improved on the ESG rating by more than 10% yoy, they would have outperformed the STOXX600 by 23.5%. They would also have outperformed the “other than positive momentum” (i.e. neutral or negative ESG momentum companies) in five out of six years over the 2013-19 period.
We also found that the average outperformance of companies with improving ESG ratings vs STOXX600 (and our overall SRI basket of 500 stocks) is more than 3% in each of those years, with a cumulative outperformance of more than 20%.
ESG ratings: How do we calculate them and do they enhance performance?
When we started our ESG integration analysis in 2012 we found little enthusiasm among investors for the idea (i.e. what “financial” value-add could there be other than ethical, marketing or philosophical positioning?). Back then the idea was to provide investors with warning flags on companies that rated poorly on ESG performance, and to reassure them about investing in companies that rated well. Our theory was that companies with strong ESG policies and good structures in place are less likely to produce unwelcome surprises. Such companies should inspire greater investor confidence and so be preferred over the long run. Since then, investor interest in ESG has grown massively, while the top 10% of ESG-rated stocks have outperformed STOXX 600 by 27.7% (see our SRI beyond integration report).
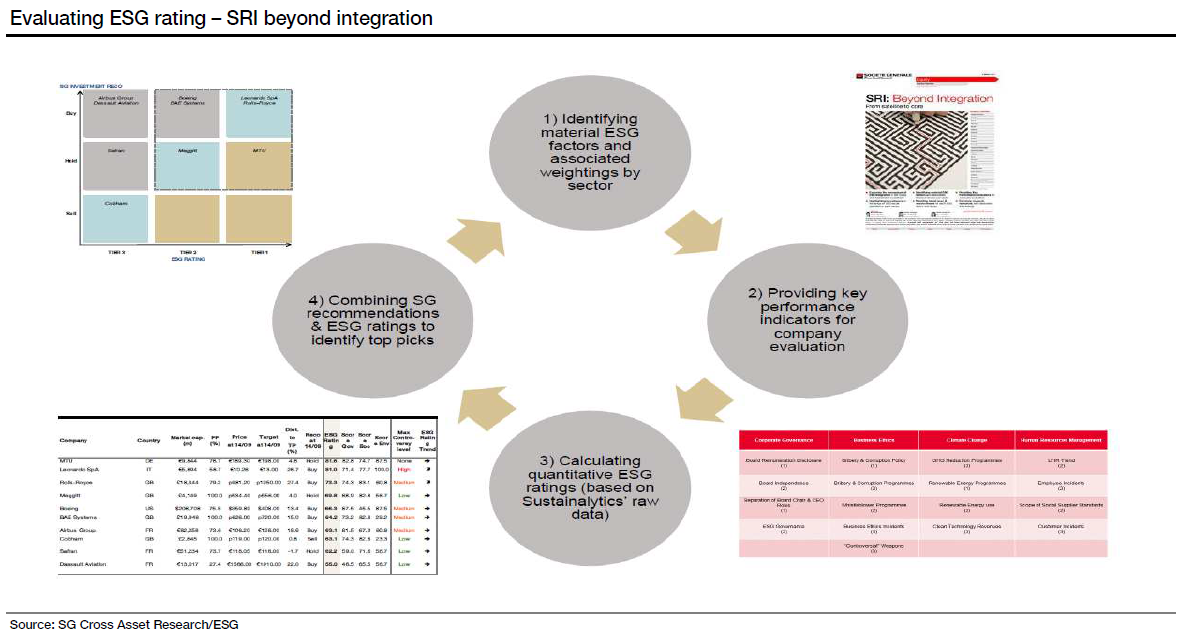
So how do we do it? To rate our stocks we use a mix of qualitative, quantitative and engagement-based approaches. As shown in the above chart, to compute ESG ratings, we identify material ESG themes for each sector and assign weights to the key indicators based on their materiality, before combining the quantitative ESG rating with our analysts’ financial recommendations. Our raw data comes from Sustainalytics. In this post, we focus only on the quantitative aspect—scoring each company on environmental, social and governance indicators to calculate their overall ESG rating.
For each sector we focus on 15-20 material indicators based on relevant themes. We try to avoid a generalist approach that might take all universally available indicators into consideration given the need to understand their relevance within the sector. Nowadays, there are hundreds of indicators available across ESG rating/data providers to analyse ESG rating of companies. However, we find it better to focus on a small number of relevant indicators for each sector to avoid losing sight of what really counts from a financial perspective.
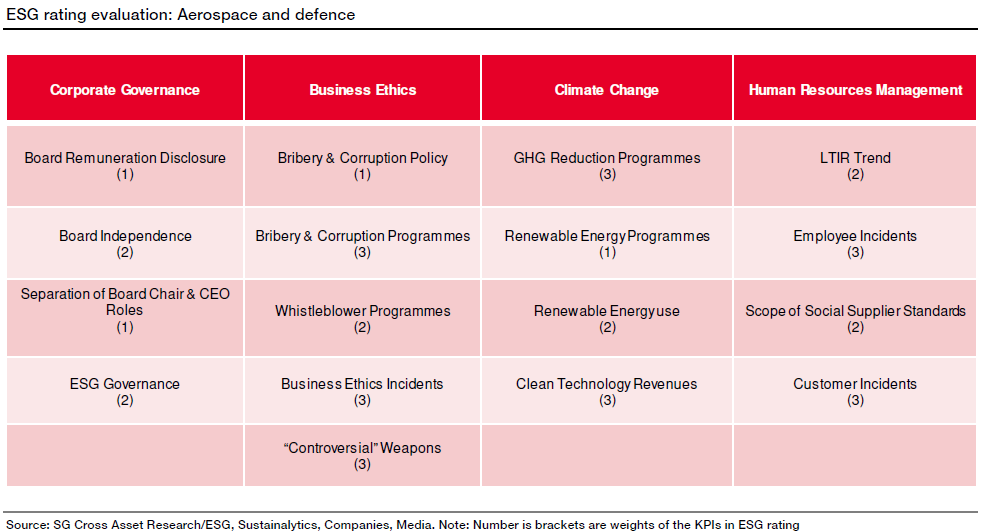
Sector example: By way of illustration, we have here broken down the ESG rating evaluation of the Aerospace & Defence sector. In this sector, we qualitatively select and analyse the 17 most material indicators based on four relevant ESG themes and weight each indicator between 1-3 based on its degree of materiality. We score each indicator between 0-100 and based on the weights assigned to each indicator, we assign each company an overall ESG rating between 0-100.
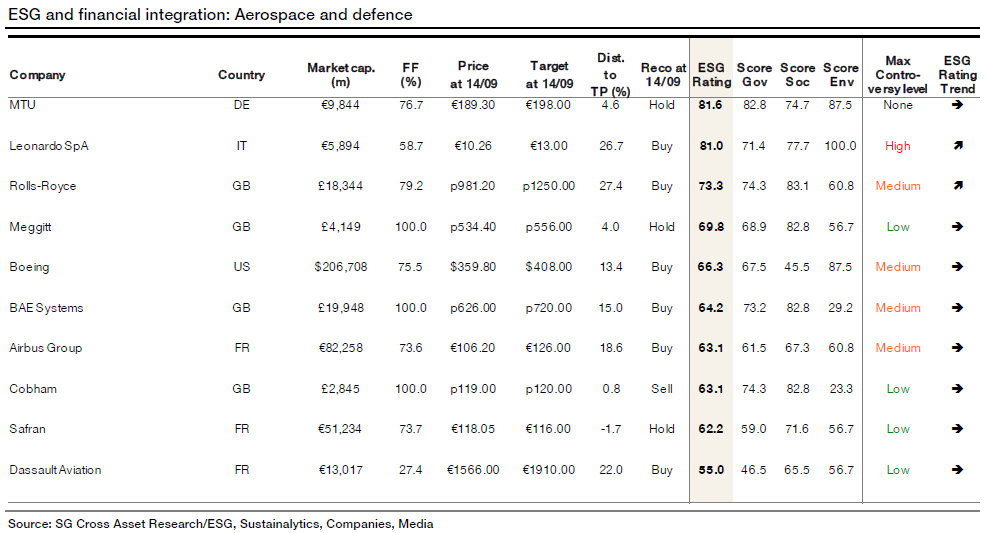
Example, for this sector, MTU scores the highest ESG rating of 81.6 and Dassault Aviation is at the bottom of the table with a score of 55. We further combine the ESG rating with the financial recommendations of our sector analysts. We repeat this across 26 sectors, rating the approx. 500 stocks covered by our equity research team.
Does it work?
Using this approach we find that the stocks that have been in the top 10% of ESG-rated companies in each sector have collectively outperformed the STOXX600. From March 2013 to September 2018, we find that using our bi-annual publications to buy these top companies in ESG ratings would have generated a cumulative alpha of 27.7%.
Can momentum on ESG ratings lead to stock outperformance?
Now that we have shown that the better-positioned ESG-rated companies did well, we are going one step further to see whether an improving ESG rating can enhance this performance. And indeed we have found that within the top ESG-rating portfolio (of approx. 150 stocks), those names that showed an annual positive change in ESG rating of more than 10% (approx. 30 names in all) did perform better than those with either neutral or negative momentum (approx. 120 companies) over our performance period.
Methodology: We define Positive ESG rating momentum as when a company’s ESG rating has improved by more than 10% on the previous year. We define Negative ESG rating momentum as where a company’s ESG rating has fallen by more than 10% on the previous year; and Neutral momentum where our rating has not changed or remained in a -10% to +10% range. Our analysis is based on the ESG ratings published in our “SRI beyond integration” reports, which have gone out twice a year since March 2013.
We are mindful that selecting stocks from among just the top 10% ESG-rated names (approx. 50 companies) would have resulted in only a few names to analyse with improving ESG ratings, so we expanded the scope of analysis to the top 30% of stocks (approx. 150 names) in the ESG universe from each sector.
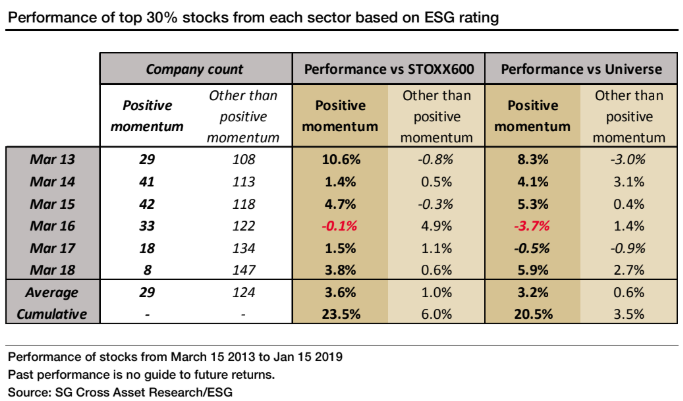
We found that the positive momentum stocks within the top 30% of the ESG-rating universe generated a cumulative outperformance of +23.5% vs STOXX600, and +20.4% vs the SRI beyond integration universe between Mar 2013-Jan 2019. This is much higher than the performance of the top ESG-rated 30% of stocks from each sector (+9.4% vs STOXX600 and +6.7% vs universe), or for those that do not meet the positive momentum criterion (+6.1% vs STOXX600 and +3.5% vs our ESG universe).
Below we present the above charts in table format, showing the annual performance over the period. We see that the positive-ESG-momentum companies, i.e. those with ESG ratings that improved by more than 10% vs previous year outperformed the “other than positive momentum” companies in five out of those six years.
The average outperformance of these companies with improved ESG ratings vs STOXX600 or the overall universe is more than 3% in each of those years and the cumulative outperformance is more than 20%.
The reason we measure “other than positive momentum” stocks and do not break it down between neutral and negative momentum is that the negative momentum companies are too few to analyse (on average, only four companies showed negative momentum on our ratings criteria, and for this reason, the performance of negative momentum companies is quite volatile. Surprisingly, on this basis over this period, the negative momentum companies showed a relative performance of +15.6% vs STOXX600 and +12.4% vs universe. This was better than the neutral momentum stocks (+5.7% vs STOXX600 and +3.1% vs universe), but the cumulative performance of the negative momentum stocks is still below the positive momentum stocks (+23.5% vs STOXX600 and +20.4% vs universe).
Turnover
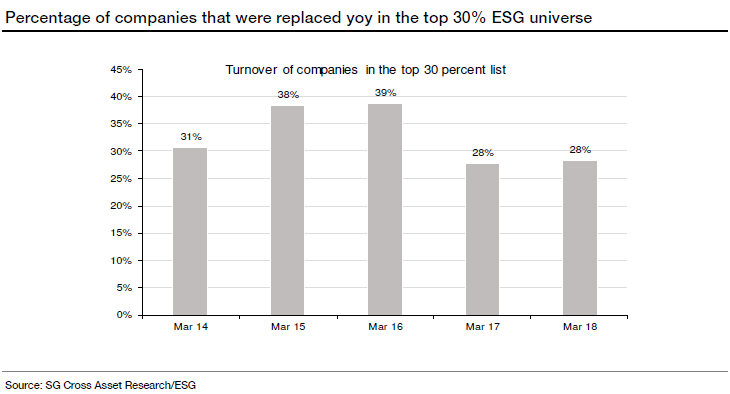
In the analysis below, we highlight that the turnover of the top 30% of stocks is 33% on average for the 2013-18 period (see table below). Also the turnover of stocks with improving ESG ratings within the top 30% would be close to 100% as this list is made up of companies that are improving their ESG rating on an annual basis. For this reason, a company that appears on the list one year due to a 10% positive change in its ESG rating has a lower chance of appearing again the following year with a consecutive change of +10%.
Sector and country breakdown
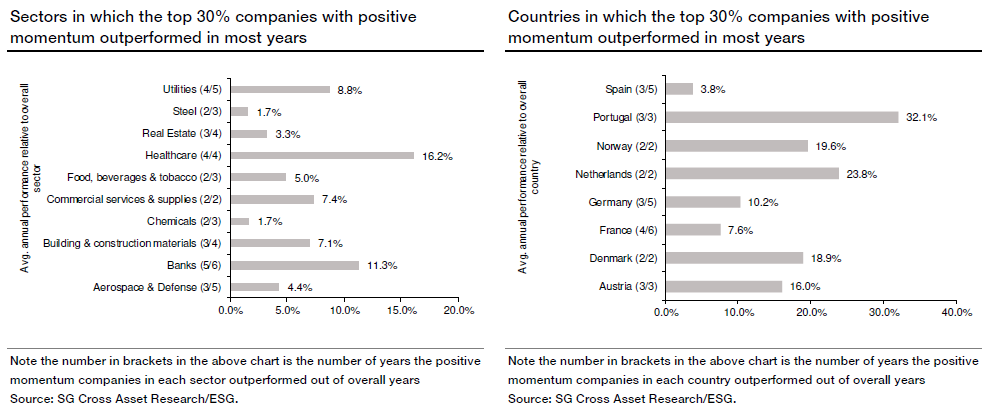
A deep dive into each sector or country is quite difficult as the number of companies that have positive ESG rating momentum is low: overall, on average, there are only 29 positive momentum companies, ranging from 8-42 stocks, over the 2013-19 period. With such a low number, we cannot expect all sectors or countries to feature on the list, and even if they do, the count will be low. Still, based on the available information, we have calculated the performance of these 8-42 positive momentum stocks every year vs their respective sector or country universe and then counted how many times out of the six years in question the sector or country did well.
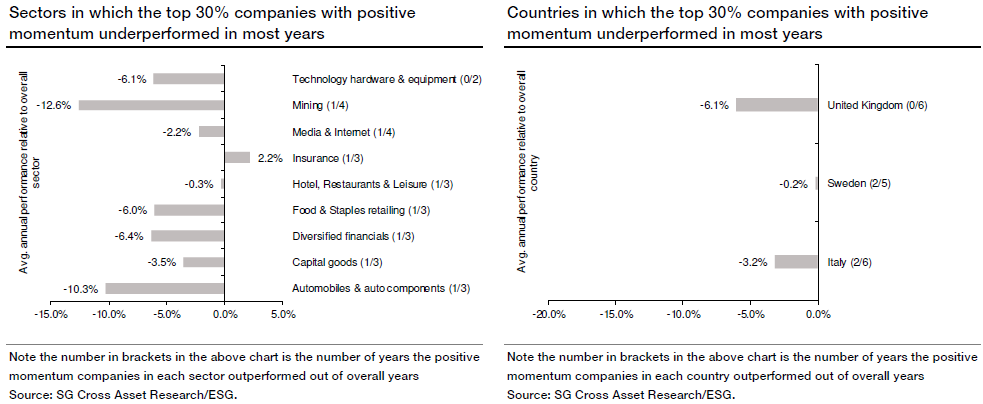
For example, Aerospace & Defence sector companies showed up on the ~30 positive momentum companies list in five years of the six, and outperformed their sector in three of those years, with an average annual outperformance of 4.4% against the sector. On the other hand, the Automobiles & Components sector outperformed in only one out of three years and the average annual underperformance was 10.3%.
There were no conclusive results when we analysed the positive momentum companies based on market cap.
Our findings on which sectors or countries contributed positively or negatively to the positive momentum stock performance is as follows:
- Sectors that performed well: Aerospace & Defense, Banks, Building & construction materials, Chemicals, Commercial services & supplies, Food, beverages & tobacco, Healthcare, Real Estate, Steel, Utilities
- Countries that performed well: Austria, Denmark, France, Germany, Netherlands, Norway, Portugal, Spain
- Sectors that did not perform well: Automobiles & auto components, Capital goods, Diversified financials, Food & Staples retailing, Hotel, Restaurants & Leisure, Insurance, Media & Internet, Mining, Technology hardware & equipment
- Countries that did not perform well—Italy, Sweden, United Kingdom
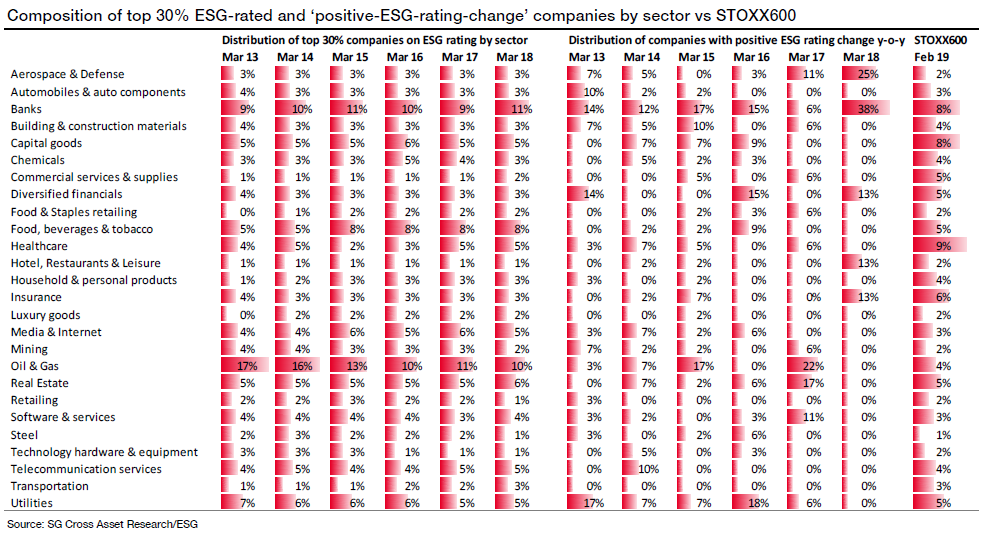
In our analysis, we are mindful of the fact that STOXX600 rebalances every quarter, while our SRI beyond integration reports rebalances ESG ratings only twice a year. Below is a summary of the sector composition of the top 30% of stocks (approx. 150 names) and those with a positive change in ESG rating (approx. 30 names) versus the STOXX 600.
“Real money” consensus vs. Societe Generale ESG ratings
In addition, we would draw your attention to a report we published in November: How contrarian are our ESG ratings?—Checking SG ESG ratings against real world ESG portfolios.
In this post, we identify the best or worst ESG-rated companies in our model to see how they overlap with the investments favoured by ESG funds using the “Responsible Investor Consensus” provided by Beyond-Ratings. We did this because investors regularly seek “colour’, in other words, do our ratings in some way clash with financial ratings, because at the end of the day, financial ratings must be taken into account.
What did we find overall? Well, in general, we found a good alignment between our own in-house top ESG ratings and the stocks held by RI’s “Beyond Ratings” funds.
We think this cross-check provides investors with a value-added tool given that some of our ESG recommendations are only partly integrated into the RI Consensus data (as of course some of these investors use our data to make decisions), while in other cases our ESG ratings appear not be taken into account in their portfolios at all.
* * *
The complete report is available here.