 Print
PrintSteve Kline is a director, Chris Kozlowski is a consultant, and Paige Patton is a senior analyst at Willis Towers Watson. This post is based on their Willis Towers Watson memorandum. Related research from the Program on Corporate Governance includes Paying for Long-Term Performance by Lucian Bebchuk and Jesse Fried (discussed on the Forum here).
Despite strong full-year 2018 financial results, shareholder returns were dampened by investor skepticism and potential headwinds heading into 2019. This trend is no surprise given our observations through the third quarter (see “S&P 1500 pay-for-performance update: Third quarter results beg the question, “Will 2018 be the high water mark for incentive payouts?” Executive Pay Matters, December 17, 2018).
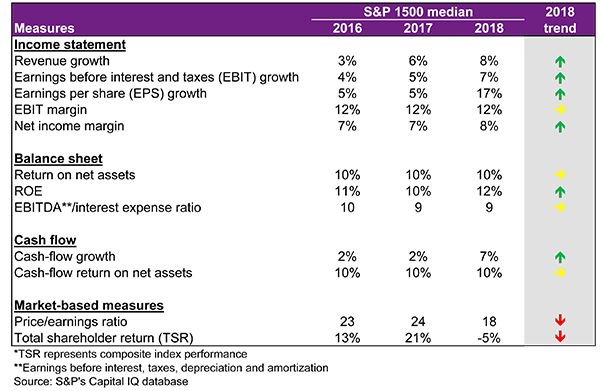
Figure 1 compares S&P1500 results in 2018 with the prior two years. While financial results across the income statement, balance sheet and cash flows are generally better than in 2017, shareholder returns declined in the fourth quarter, losing five points in 2018 following consecutive years of double-digit shareholder returns.
Figure 1. S&P 1500 scorecard
Actual 2018 results differed from analysts’ forecasts:
- Revenue growth of 8% exceeded the 6% expectation.
- Bottom-line growth of 17% matched the early-year expectation.
- Operating profitability lagged as 7% EBIT growth missed the 10% expectation.
- Returns on the balance sheet and cash-flow growth fell short of expectations.
The median CEO performance bonus in 2017 for the S&P1500 was 115% of target, suggesting an even higher median is likely for 2018. But many long-term incentive (LTI) plans are based on relative shareholder returns, making payouts harder to predict. Notably, some companies may be impacted by payout limits that kick in when absolute shareholder returns are negative. Nearly two-thirds of the S&P1500 had negative shareholder returns in 2018, so it would not be surprising to see circuit breakers or negative discretion come into play.
This could lead to an interesting proxy season as companies may be disclosing robust annual bonuses despite weak shareholder returns and modest LTI payouts. We will review the impact of 2018 performance on incentive plan payouts in our June blog post.
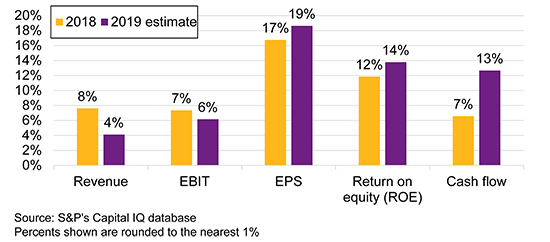
Figure 2 compares the 2019 outlook with actual 2018 results. Revenue and EBIT growth are expected to decelerate. However, bottom-line earnings are expected to grow at an even greater pace. Returns and cash-flow growth are expected to improve in 2019.
Figure 2. S&P 1500 analysts’ 2019 expectations compared with 2018 actual results
An important first step in keeping pay aligned with performance is to understand your company’s absolute and relative performance. Was your performance in 2018 where it should be, or higher or lower than others in the sector? How do your 2019 expectations compare with your 2018 actual results, and how do they compare with others in the sector?
The U.S. appears to be in the later stages of the business cycle, as suggested by expectations for slowing revenue and EBIT growth. Even so, performance expectations remain relatively strong on a historical basis. Accordingly, we can expect compensation committees will set compelling incentive plan targets for the 2019 incentive season. Geopolitical risks such as a potential trade war with China and the spiraling complexities of Brexit cast uncertainty on 2019 performance.