 Print
PrintRic Marshall is Executive Director of ESG Research, Panos Seretis is Head of ESG Research, and Agnes Grunfeld is Vice-President at MSCI Inc. This post is based on a MSCI memorandum by Mr. Marshall, Mr. Seretis, and Mr. Grunfeld.
Related research from the Program on Corporate Governance includes The Myth that Insulating Boards Serves Long-Term Value by Lucian Bebchuk (discussed on the Forum here); Share Repurchases, Equity Issuances, and the Optimal Design of Executive Pay, by Jesse Fried (discussed on the Forum here); and Short-Termism and Capital Flows by Jesse Fried and Charles C.Y. Wang (discussed on the Forum here).
Executive Summary
- Share buybacks have become the favored means for distributing cash to investors among large-cap S. companies, exceeding cash dividends every year since 1997 at 388 of the 610 companies (63.6%) we studied.
- A majority of the companies we observed bought back shares when prices were high rather than low, as buybacks have replaced dividends as the dominant way of returning cash to investors at many companies.
- Contrary to concerns expressed by many observers, we found no compelling evidence of a negative impact from share buybacks on long-term value creation for investors overall. In each of the areas we examined, beginning with MSCI ESG Ratings but also including CAPEX, R&D, new debt issues, and, most importantly, value creation, the companies that were most actively distributing cash to their investors were also the strongest companies.
- Companies where index investors were the largest shareholders included a much wider range of buyback impacts, good and bad, than companies where the largest shareholders were buy-and-hold investors: total returns for the buy-and-hold investor companies were 18% higher, on average, than for the index investor companies from 2007 to 2016.
Background
Prior to 1982, share buybacks were virtually non-existent in U. S. equity markets due to regulations aimed at limiting the potential for share price manipulation. The U.S. Securities and Exchange Commission reconsidered its position in 1982, adopting Rule 10b-18, which established a safe harbor for companies wishing to distribute cash to investors via share buybacks. Both the frequency and amount of share buybacks began to rise almost immediately, eventually superseding dividends as the primary means of distributing corporate profits to investors. At the 610 MSCI USA Index constituents [1] we studied, total buybacks have exceeded total dividend payments every year since 1997.

The decision to buy back shares is one of the most important strategic decisions a corporate board can make. Share buybacks are an integral part of a company’s overall capital management, which requires the continual balancing of operating costs, capital expenditures (CAPEX) and research and development (R&D) against revenues and tax obligations. Buybacks are a key element of a company’s corporate governance, i.e., the primary means by which a company may create and preserve value on behalf of its investors.
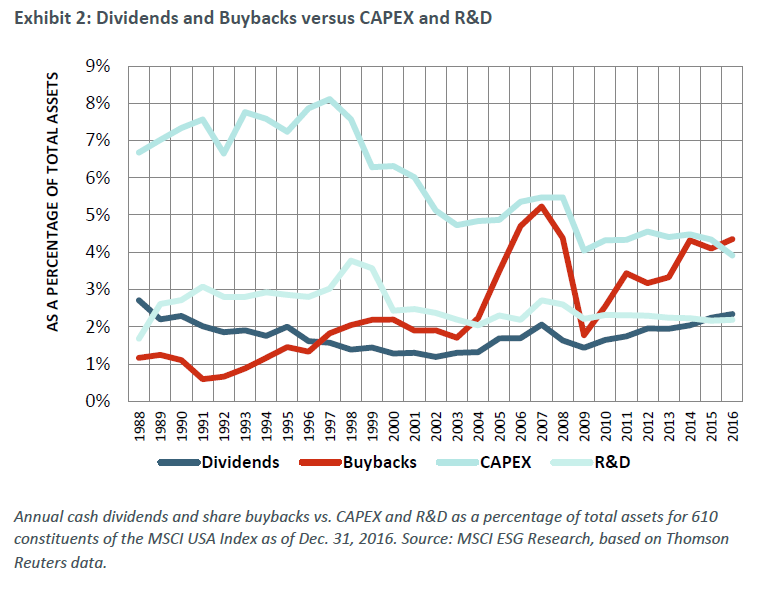
As a means for returning value to investors, buybacks offer companies and investors greater flexibility than dividends: Companies can more easily manage their tax liabilities and market expectations on both the timing and amount of buybacks. Investors may also prefer buybacks over dividends because they can facilitate more frequent reallocation of existing capital. But some investors worry that companies might prioritize buybacks over either long-term capital investments or R&D. [2] In fact, both CAPEX and R&D spending at our sample companies has declined in almost every year since 1997, with total buybacks exceeding total CAPEX for the first time in 2015.
Of these 610 companies, 554 (91%) bought back shares at some time during our study period, while 499 (82%) paid cash dividends. Eighty-nine bought back shares but paid no dividends, while 34 paid dividends but did not buy back shares.
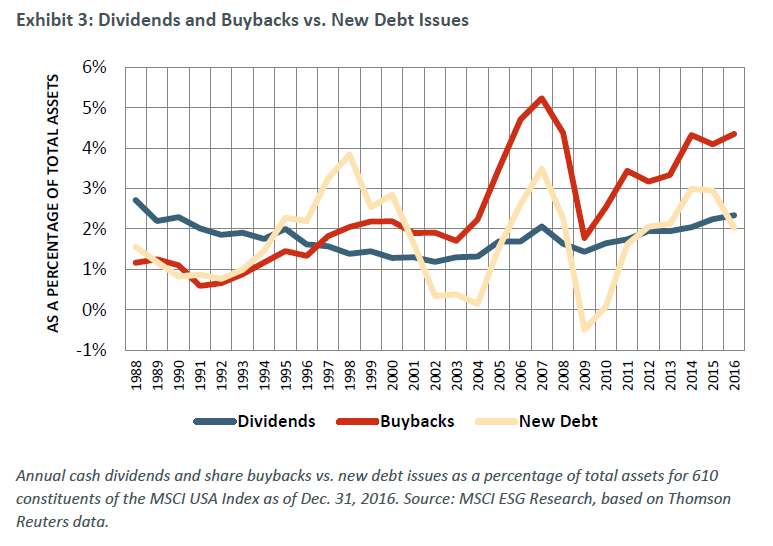
Some companies have also borrowed to buy back shares, raising concerns that some firms might over-leverage their balance sheets. Among the companies we studied, aggregate new debt issues appear to have closely tracked aggregate share buybacks since about 2003, as shown in Exhibit 3.
Some observers fear that the corporate embrace of share buybacks reflects a dearth of new ideas among CEOs and boards, [3] or favors short-term gains over long-term sustainability. [4]
Others have lamented the possible use of share buybacks by CEOs to enhance their own equity-based pay gains, particularly at those companies where pay has not always been well aligned with long-term investment returns. [5]
Surprisingly, there has been very little pushback from investors regarding the growing use of share buybacks. Further, buybacks have continued to rise even as many of these companies were achieving record high valuations, contradicting the long-standing assertion that companies should buy back shares only when their shares are under-valued. [6] A majority of these companies have repeatedly bought back shares at prices that reflected possible over- rather than under-valuation, [7] and in addition to rather than as a substitute for cash dividends.
Brav et al. (2005), [8] who surveyed 384 corporate financial executives, wrote that “…many of those firms that pay dividends wish they did not, saying that if they could start all over again, they would not pay as much in dividends as they do … many of these firms would prefer to pay out in the form of buybacks.”
We looked to the U.S. to better understand buyback activity. While we found evidence of share buyback activity in virtually every market globally between 1988 and mid-2017, the dollar value totals in the U.S. market (particularly among U.S. large caps) dwarfed other markets. [9] Global dividend and buyback activity is shown in Appendix 1 of the complete publication (available here).
We ultimately identified 610 companies for deeper analysis. All of these companies were constituents of the MSCI USA Index as of Dec. 31, 2016. We then narrowed our focus to the most recent 15-year period (ending December 2016) for which sufficient buyback and other financial data was available.
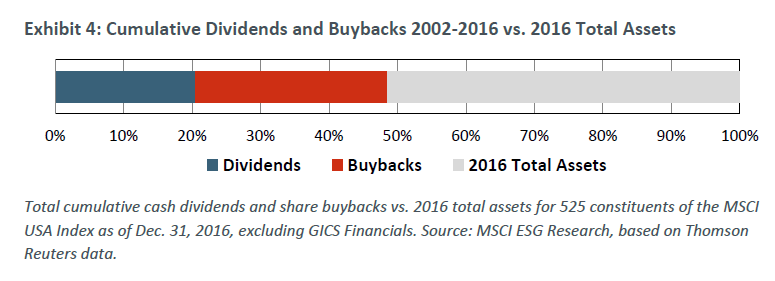
Over this 15-year period, these 610 MSCI USA constituents paid over $3.86 trillion in cash dividends, and repurchased just under $5.19 trillion of their own shares. Excluding financial companies, which report total assets differently, the combined total payout was equal to 48.6% of total 2016 constituent assets, or $3.2 trillion in dividends, and $4.4 trillion in buybacks, as shown in Exhibit 4.
During this period, 140 of these companies paid out the equivalent of more than 50% of their total 2016 assets on buybacks; 53 of these companies repurchased shares equivalent to more than 100% of their 2016 assets. In comparison, only 37 companies paid out more than 50% of 2016 assets in dividends, while 24 paid no dividends at all.
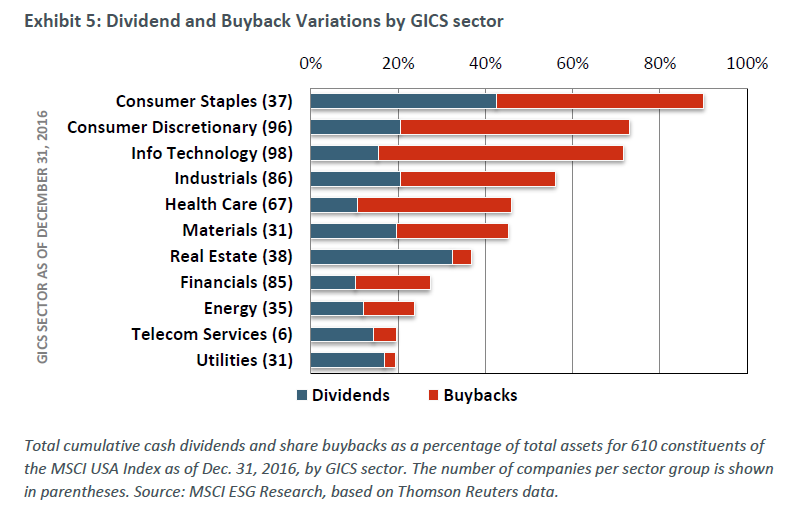
As shown in Exhibit 5, both dividends and buybacks varied considerably between GICS® [10] sectors: Buybacks were highest among info tech and consumer discretionary/staples sectors, and lowest among telecom, real estate and utilities. Such differences were even greater at the GICS industry group level, with three groups (food & restaurants, specialized finance and household products) on average exceeding 100% of 2016 assets in total payouts. [11] These differences were not surprising, as some industries were simply more profitable during this period, while others struggled to such a degree that even dividends could only be funded using borrowed capital, leaving little scope to repurchase shares.
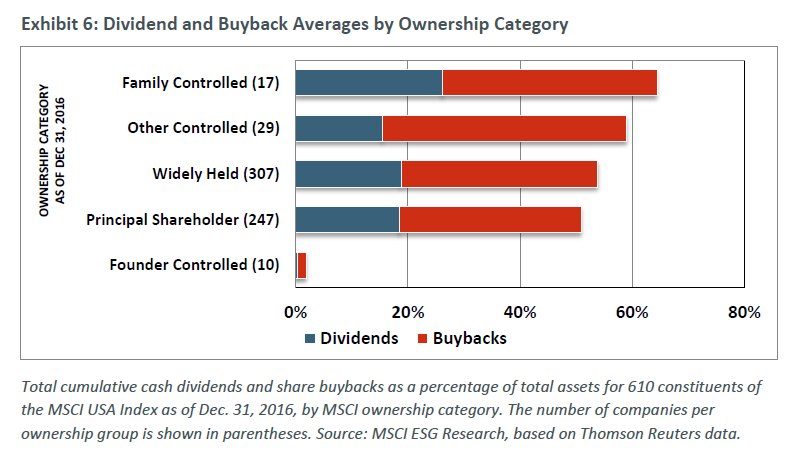
We also found differences when we looked at company ownership. Family-controlled firms paid more in cash dividends than other ownership groups, on average, though they also participated heavily in share buybacks, as did nearly all other controlled companies. But founder-controlled companies, such as Alphabet, Inc. or Facebook, Inc., allocated very little capital to either, as shown in Exhibit 6.
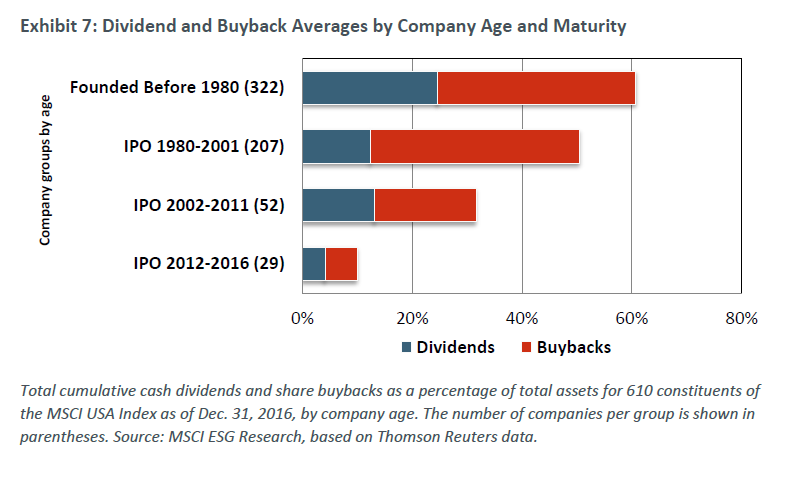
These sector- and ownership-based differences were closely related, and in many cases overlapping. So were the differences we observed based on company age and maturity. The most active repurchasers were companies that first listed from 1980 to 2001; such older, more established companies paid more in dividends, on average, while still actively buying back shares, which resulted in even higher total payouts. These differences are shown in Exhibit 7. [12][13]
Buybacks and Managing for the Long Term
First we wanted to determine whether the companies in our sample that were most actively engaged in share buybacks were doing so at the expense of managing for the long term. We started by looking at these companies’ ESG Ratings, as ESG Ratings aim to capture how well companies are positioned to manage financially relevant ESG risks and opportunities. In previous research, MSCI has shown that MSCI ESG Ratings have signaled risks that may materialize over a longer-term time frame. [14]
Buybacks and ESG Ratings
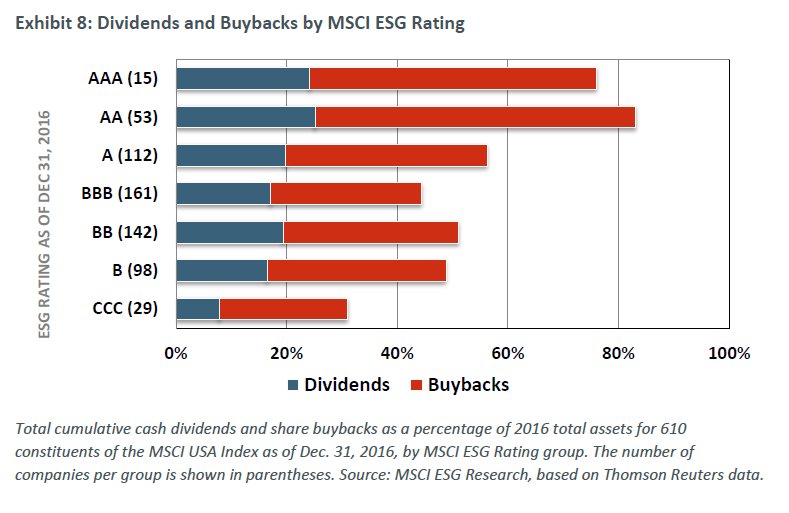
The companies in our sample that were most active in buying back shares during this period and made the highest total payouts, were also, on average, the most highly rated, based on their MSCI ESG Ratings [15] as of the end of 2016. The least active companies were also the lowest rated.
Why would there be such a strong alignment between MSCI ESG Ratings and total payouts in general, and share buybacks in particular? We sought to answer this question by examining other aspects of these companies’ capital management, specifically their CAPEX and R&D spending. Were these allocations also aligned with our ESG Ratings?
Capex and R&D
Consistent with the theory of competitive corporate life cycles first proposed by Stigler in 1951, [16] we expected that more recently listed companies, and particularly those with still active founders at the helm, would invest more heavily in their own futures and would be less inclined to buy back their own shares, while older, more mature and established companies would be more likely to distribute value to their investors. This did turn out to be the case. Some of the decline in CAPEX spending we found could be attributed to the relative overall maturity of U.S. large-cap equities.

The highest and lowest rated companies were also the highest and lowest investors in CAPEX, respectively, as shown in Exhibit 9. The aggregate decline in CAPEX spending we observed, as shown in Exhibit 2, could also be tied to other changes in the U.S. economy, where the emphasis has been shifting steadily away from manufacturing and production. Companies in some industries have benefitted from increased productivity, and many companies have elected to achieve growth via acquisition, which could also lower capital expenditures. But nearly all of the companies that either paid cash dividends or bought back shares also reported some level of regular CAPEX spending. We did not find any compelling evidence to indicate that these companies elected to buy back shares to the exclusion of investing in their own futures.
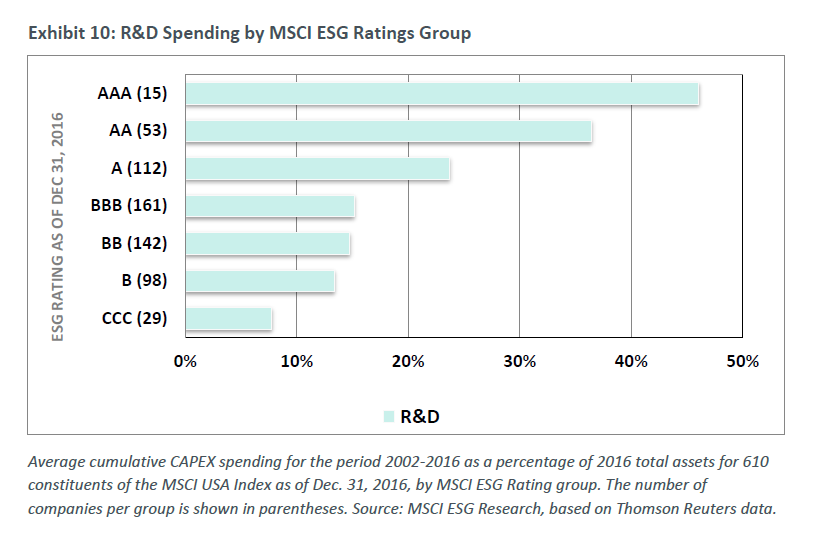
Research and development spending, however, was very strongly aligned with our ratings, as shown in Exhibit 10.
Optimal R&D?
Research and development investments offer corporate managers in certain industries ways to invest in their company’s future, potentially creating value for investors.
We consulted with Professor Anne Marie Knott at Washington University’s Olin Business School on the importance of R&D spending, based on her experience in developing her Research Quotient (RQ) Ratings model, as described in her book, How Innovation Really Works: Using the Trillion-Dollar R&D Fix to Drive Growth (McGraw-Hill, 2017).
According to Prof. Knott, a 10% boost in R&D increased revenues, on average, by 1%. Companies that invested heavily in R&D, and measured high on the RQ Ratings scale, returned better than that, and companies who were weak R&D investors, with low RQ Ratings, performed worse, as can be seen in Exhibit 11.
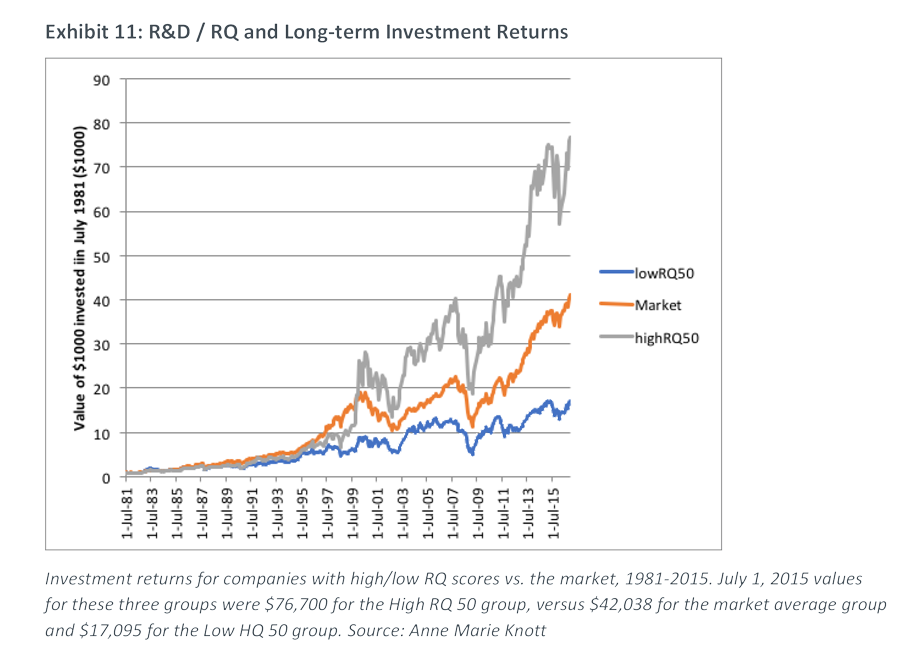
Companies who were best at R&D over the past 35 years returned approximately double the market return. Those who were weak at R&D substantially underperformed.
The complete publication is available here.
Endnotes
1As of Dec. 31, 2016.(go back)
2“Share Buybacks and their Governance Implications.” (2017). International Corporate Governance Network.(go back)
3Ayres, R. and M. Olenick. (2017). “Secular Stagnation (Or Corporate Suicide?).” INSEAD Working Paper.(go back)
4Lazonick, W. (2014). “Profits Without Prosperity.” Harvard Business Review.(go back)
5Edmans, A., V.W. Fang and K. A. Lewellen. (2017). “Equity Vesting and Investment.” The Review of Financial Studies, Vol. 30, No. 7, pp. 2229–2271.(go back)
6For one of the more frequently cited versions of this advice, see Buffet, W. E. (2012). “Annual Letter to Berkshire Hathaway Shareholders.” Berkshire Hathaway.(go back)
7See Liu, H. and E. P. Swanson. (2016). “Is Price Support a Motive for Increasing Share Repurchases?” Journal of Corporate Finance, Vol. 38, pp. 77-91, for an examination of one possible explanation for this behavior, which is beyond the scope of the current analysis.(go back)
8Brav, A., J. R. Graham, C. R. Harvey and R. Micaely. (2005). “Payout Policy in the 21st Century.” Journal of Financial Economics, Vol. 77, No. 3, pp. 483-527.(go back)
9Unless otherwise noted, all financial reporting figures used in this report were obtained from Thomson Reuters.(go back)
10The GICS industry classifications system is maintained jointly by MSCI and S&P Global.(go back)
11The GICS classification uses four levels of increasing specificity: sector, industry group, industry and sub-industry.(go back)
12Nearly half of the companies we studied (48%) were first listed after 1980, and 13.5% were first listed after 2002.(go back)
13While it was not included in our sample, our own firm, MSCI, Inc. has actively engaged in share buybacks since 2008, and paid dividends since 2014.(go back)
14Giese, G., L.-E. Lee, D. Melas, Z. Nagy and L. Nishikawa. (2017). “Foundations of ESG investing, Part 1: How ESG affects Equity Valuation, Risk and Performance.” MSCI Research Insight.(go back)
15See MSCI ESG Ratings Methodology document for more details on the design of the ESG Ratings.(go back)
16Stigler, G. (1951). “The Division of Labor is Limited by the Extent of the Market.” Journal of Political Economy. Vol. 59, No. 3, pp. 185-193.(go back)
One Comment
This is very informative, thank you for sharing!