Monthly Mailing Metrics: Surprised? I Was
We recently quietly added a new feature to FeedBlitz for our email publishers. It’s a summary analysis of all yor mailings for a given month — you can access it via your mailing list’s dashboard and clicking the highlighted link in the Mailing Metrics tile.
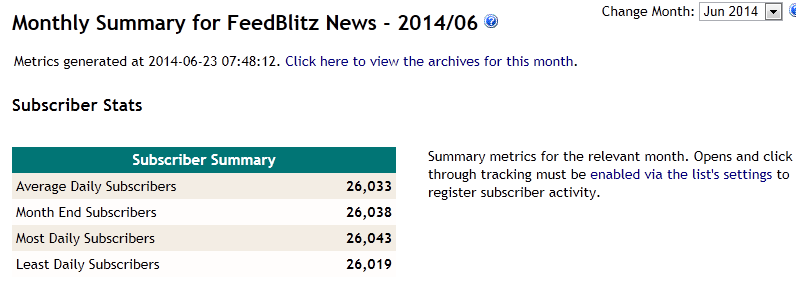
Monthly Subscriber Metrics
It shows basic subscriber stats for the month (here are FeedBlitz News’ for June 24 so far); and summary metrics – sent, opens, clicks, bounces, unsubscribes, complaints, etc. – for the month.
It’s pretty interesting to look at it, because these data allow you to figure out whether any given mailing did better or worse than average. That’s neat.
But where the surprises – and I did find unexpected results – are found is in what FeedBlitz does next for each mailing you sent in a given month. Given all your mailings, and depending on your list’s configuration, FeedBlitz will tell you for any given month which mailings were:
- Most and least opened (driven by subject lines)
- Most and least clicked through (call to action / content driven)
- Most and least engaging (driven by click to open rates)
- Least popular (i.e. generated the most unsubscribes)
- Most spammy (i.e. generated the most complaints).
Clicking on the mailing in each category takes you to the detailed metrics for the highlighted mailing. And boy, was I surprised by what I found. I’ll share June (so far) and last month’s for this mailing, FeedBlitz News.
Here’s June so far (click to enlarge):
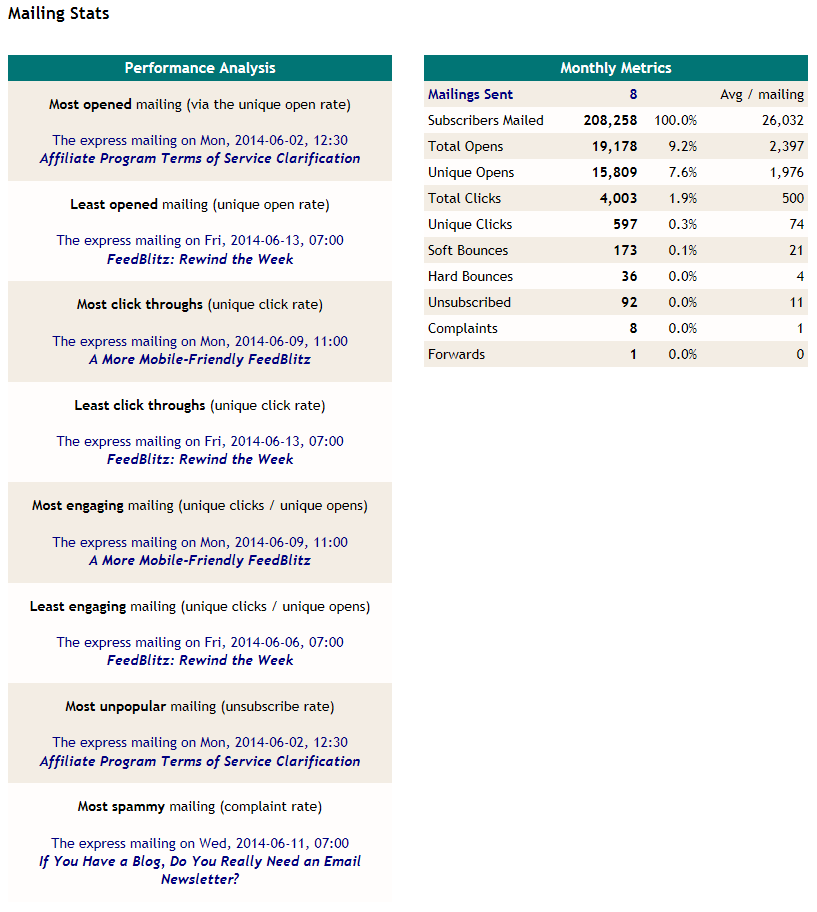
Ignoring my fairly dismal open rate, which I should really work on, the surprise here was that the terms of service change garnered the most opens, given that we don’t have that many affiliates. Clearly that’s a program I should be talking more about (noted). It was also the least popular, in that it generated the most unsubscribes (perhaps I should talk less about it?! Argh! Nothing is simple … nobody said interpreting the analysis would be easy).
The most engaging mailing this month (so far) has been the one about our improved mobile UI. That makes sense, I’m glad to see it there. The shocker? That our guest post on blog subscriptions vs. traditional newsletters, on an email marketing firm’s blog, generated the most complaints! That’s a real head scratcher, right there. File under: Go figure.
So how about last month, then? Switching the drop down to May and here’s what I get (again, click to enlarge the image):

A “Rewind the Week” mailing was the most opened — yet that doesn’t help me at all with subject lines, since the least opened was the identically titled post from two weeks before — and, again, industry commentary about an email topic proved the most unpopular. Y’all are a tough crowd, apparently.
Just, wow. Surprising? Yes. At times, confusing? You betcha. Fascinating? No doubt!
What will you find in your results? Check out your mailing list’s dashboard, click through to the monthly metrics and explore.