Robert Newbury is a director at Willis Towers Watson. This post is based on a Willis Towers Watson publication by Mr. Newbury, Becky Hiddleston, and Erik Nelson.
Executive pay practices settled in to a new normal in 2016, characterized by modest pay increases, continued emphasis on performance-oriented compensation, and annual and long-term incentive (LTI) plan design features and metrics consistent with those of recent years.
In our annual examination of chief executive officer (CEO) pay among early proxy filers at S&P 1500 companies, we found that increases in total compensation for CEOs remained fairly moderate again last year, driven largely by uneven corporate performance, increasing bonuses and a sharp decrease in the value of stock option exercises. The analysis is based on 365 S&P 1500 companies with consistent CEOs that filed proxies disclosing 2016 pay by the end of March, as detailed in our recent press release.
The 2016 pay landscape
Target compensation levels in the companies studied continue to increase, but the pace of change slowed in 2016. Overall, CEO compensation levels increased modestly, as base salary and target bonus increased 2% and 3%, respectively, consistent with the rate of increases in 2015. The biggest change in target pay compared to 2015 is in LTIs. Target LTI values, which represent the grant value of stock options, time-vested restricted stock and the target value of long-term performance awards, increased 4% in 2016, compared to 9% in 2015.
LTI compensation is still growing, but lower 2016 performance expectations and results have tempered prior period growth. The pay-for-performance environment has inclined companies to maintain consistent year-over-year target LTI levels and rely on LTI program mechanics to provide realizable LTI levels that are aligned with performance based on both stock price movement and performance outcomes.
When looking at total CEO pay levels, there were modest increases across the board, regardless of compensation definition (see Figure 1 for a summary of CEO pay changes by various pay definitions). Total pay, which represents total pay reported in the Summary Compensation Table, and target total direct compensation increased 6% and 5% at the median, respectively. These increases align with the compensation element increases referenced earlier, as well as bonus payouts that approximated target for the 2016 fiscal year.
Figure 1. Rate of change in CEO pay by various pay definitions

Earned pay—defined as the sum of base salary, annual and LTIs earned, the value of vested stock and the exercise value of stock options—was relatively flat, increasing 4% in 2016 over 2015, compared to a 13% increase in 2015. This flattening was driven by the decreased value of stock option exercises in 2016, down 55% from 2015 to 2016, and directly tied to slower financial growth resulting from the decreased market value of stock in the first three quarters of 2016, despite strong fourth-quarter stock market performance after the U.S. presidential election.
Examining pay-for-performance alignment
The modest increases that we’re seeing in CEO compensation levels are aligned with what we’re seeing from a performance perspective as well. This tells us that companies are continuing to focus on pay for performance and are designing their compensation programs accordingly.
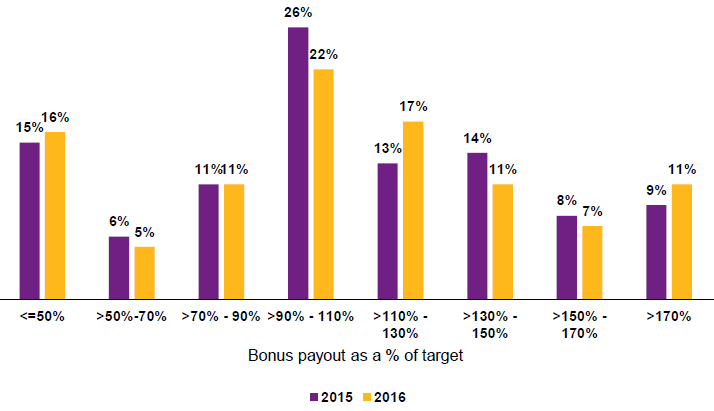
In 2016, CEOs received an annual bonus payout (around target) for performance levels that were essentially unchanged from the prior year. In 2016, the average CEO bonus payout was 106% of target, compared to an average bonus payout of 107% of target in 2015. Over half (59%) of CEO bonuses were above target, consistent with 2015.
Figure 2 shows the distribution of CEO bonus payouts in 2015 and 2016. While the distribution of bonuses is fairly similar to 2015, more CEOs received bonuses below 50% of target and between 110%–130% of target, while fewer CEOs received bonuses around the target range of 90%–110% of target.
Figure 2. Percentage of CEOs receiving an actual bonus as a percentage of target

Unsustainable historical growth levels affected goal setting in 2015 and continued in 2016. Twenty-three percent of companies targeted at least one 2016 metric at less than the prior year’s actual performance level. However, only 22% of this group had actual results that were below target. This means that 78% of these companies performed at or above target in 2016, which may indicate the goals were too forgiving, especially given that this is the second year in a row that we’ve observed this trend.
While more modest goals that coincide with an economic slowdown may be appropriate, the extent of their reduction becomes the question. Compensation committees should review this issue carefully, balancing company strategy and shareholder expectations with the need to maintain pay-for-performance alignment, pay for strategy and motivate management. Moving forward, it will be interesting to see how more optimistic 2017 performance expectations influence goal setting for the 2017 plan year as stakeholders might expect target levels to increase versus the prior year, on average
The use of discretion
Although most incentive plans are formulaic, compensation committees have the authority to exercise discretion when determining final payouts. Seventeen percent of companies made unplanned adjustments to final incentive plan payouts for the 2016 plan year, more often applied to annual incentive payouts (95% of cases).
The most frequently disclosed reason for the use of discretion was to strengthen the relationship between pay and performance, cited 35% of the time. Among companies citing this reason, the use of discretion resulted in a lower payout than would have otherwise been provided under the plan in almost all cases. Individual performance was the second most common reason for adjusting final incentive payouts, cited 30% of the time. In this case, discretion resulted in a higher payout than would have otherwise been provided under the plan in almost all cases. This illustrates that while the use of discretion is limited, companies are being proactive about managing their executive pay programs to ensure that payouts appropriately align with performance and also recognize executives’ individual contributions.
This continued emphasis on pay-for-performance alignment is clearly shaping compensation program design, but less so for smaller companies. Large companies have a more performance-oriented compensation program than small companies, due in part to external optics and shareholder pressures, which are more pronounced at large companies. Performance-based compensation represents 75% of the CEO pay mix among the S&P 500 and just 52% of the CEO pay mix among the small-cap S&P 600.
While performance-based plans continue to be the dominant LTI vehicle for companies generally, the LTI mix varies by company size, with larger portions of the LTI value tied to performance awards and stock options at larger companies compared to smaller companies. Performance awards make up 55% of the LTI mix at large-cap companies and only 42% of the LTI mix at small-cap companies. Small-cap companies have 40% of their LTI mix based on time-vested, restricted stock awards, while large-cap companies have only 20% of their LTI mix tied to time-vested, restricted stock awards.
Is the pay model working?
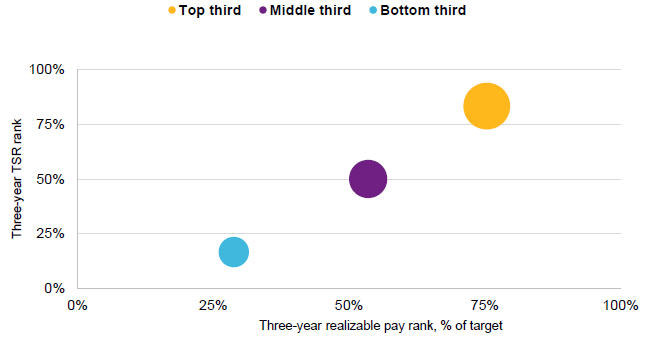
Our efforts to determine if the pay-for-performance model is working included a review of CEO realizable pay over a three-year period versus total shareholder return (TSR) over a three-year period to see how the two were related (see Figure 3). Realizable pay reflects the three-year sum of reported base salary, actual annual incentives and bonuses earned, and the intrinsic value of equity granted during the period and valued at the end of the period (i.e., the value of restricted stock, in-the-money value of stock options and the actual payout value of performance shares at the end of the performance period—performance shares granted and still outstanding during the period are valued at target).
Figure 3. S&P 1500 three-year realizable pay as a percentage of target versus TSR rank*

*Percentage rank, bubble-size scaled to median three-year realizable pay/three-year target pay
The analysis here tells us that three-year realizable pay is correlated to three-year TSR over the same period. For example, the median TSR for those companies in the top third is 79%, which coincides with a median three-year realizable pay as a percent of target TDC equal to 129%. Conversely, those in the bottom third from a TSR perspective had a median three-year TSR of –6% and three-year realizable pay as a percent of target TDC equal to 83%.
This analysis, coupled with the tendency for compensation committees to exercise discretion in determining final award payouts, would indicate that the pay-for-performance model seems to be working, but may be more effectively calibrated at larger firms with compensation programs more heavily weighted toward performance-based elements compared to smaller, emerging firms.
Looking ahead to the new reality
We believe the Trump administration’s early priorities could have important economic and business implications. Four potential early actions and impacts include:
- The possibility of lower business taxes could trigger repatriation and a capital spending surge, which might cause companies to rethink their incentive metrics.
- Fewer governmental regulations may create growth opportunities, but could also require boards and management to consider elevating their self-regulation, which would cause companies to consider their human capital risk.
- The potential repeal or delayed enactment of legislation may enable companies to free up some of their internal resources and devote them to other value-added activities.
- Higher business performance expectations due to the post-election surge in stock prices may give some companies pause and require them to revisit their incentive performance targets and ranges.
We believe each of these four early indicators will have economic and business ramifications, which, in turn, will have implications for executive compensation programs, policies and practices. Higher 2017 performance expectations combined with prospects for a more favorable regulatory landscape are likely to create increased emphasis on performance metrics, incentive plan goal setting and paying for strategy as companies adapt to a new political and economic environment.
 Print
Print