 Print
PrintBrian Tayan is a Researcher with the Corporate Governance Research Initiative at Stanford Graduate School of Business. This post is based on a recent paper by Mr. Tayan; Ian D. Gow, Assistant Professor of Business Administration at Harvard Business School; and David Larcker, James Irvin Miller Professor of Accounting at Stanford Graduate School of Business.
Shareholders and members of the public have a vested interest in understanding the reasons behind CEO and senior executive departures. Because of the influence these key individuals have on corporate performance, investors want to know whether executive turnover is the result of a carefully planned transition or whether it is instead due to forced termination for poor performance or governance-related issues. Unfortunately, succession at many companies tends to occur in a black box. Members of the public are not privy to the boardroom discussions that precede turnover events, and the public statements announcing executive departures usually contain boilerplate language that does little to elucidate the factors that led to their occurrence. [1] This lack of clarity makes it difficult for shareholders to determine the degree to which board members hold senior executives accountable for performance and to assess governance quality.
Researchers have put considerable effort into untangling whether CEO departures are voluntary or involuntary, with mixed results. Some studies classify turnover as “involuntary” if press releases or the news media make explicit reference to a CEO being fired or forced out. Others factor in circumstantial evidence, such as age, tenure with the company, severance payments, and post-separation employment outcomes. These studies reach vastly different conclusions about the likelihood of a CEO being involuntarily terminated, with rates ranging from 3% to 40%. [2]
Push-out Score
Recently, Daniel Schauber—a financial journalist and owner of the firm Exechange—developed a model called the Push-out Score™ to systematically evaluate the circumstances surrounding CEO and CFO departures. Unlike models that strictly categorize executive departures as forced or voluntary, the Push-out Score produces a score on a scale of 0 to 10 that amounts to a confidence level that the CEO was compelled to leave. (A score of 0 indicates that it is “not at all” likely that the executive was terminated or pressured to resign; a score of 10 indicates that termination is “evident.”)
The Push-out Score incorporates publicly available data along nine dimensions:
- Form of the management change announcement
- Language in the announcement
- Age of the departing executive
- Notice period (time between announcement and departure)
- Tenure
- Share price development
- Official reason given
- Circumstances of the management change
- Succession (e.g., external vs. internal, permanent vs. interim replacement)
These dimensions are not strict, black-and-white variables but take into account extenuating circumstances and incorporate the expert judgment of Exechange. For example, the Exechange model considers the tone, clarity, and language used to describe the departure, including statements by board representatives and the outgoing CEO or CFO. It considers not only the official reason given for the departure, but additional evidence that weighs on the credibility of that reason (see Exhibit 1). If any factor raises a red flag or creates suspicion, the dimension is assigned a 1; if not, it is assigned a 0. The Push-out Score is equal to the sum value of these nine dimensions. If the company explicitly states that the CEO or CFO is terminated, the Push-out Score is 10. [3]]
Exhibit 1 – Push-out Score: Factors Considered (Selected)
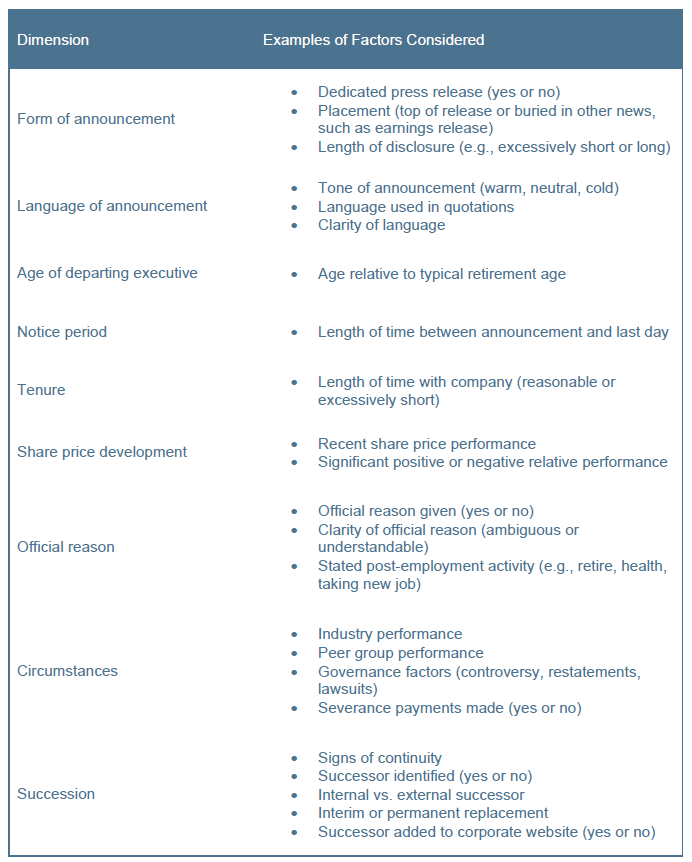
Source: Exechange. Summarized by the authors.
The result of this model is that executive departures are rarely categorized as clearly voluntary or involuntary. A scatter plot of 226 Push-out Scores over the 6-month period November 2016 to April 2017 shows the distribution of scores. The average score is 5, with 72 departures assigned a score between 0 and 3, 111 between 4 and 7, and 43 between 8 and 10 (see Exhibit 2). This is indicative of the range of ambiguity accompanying executive turnover in general and helps to explain why academic and professional researchers have so much trouble determining the relation between CEO performance and termination.
Exhibit 2 – Push-out Score: Range of Outcomes
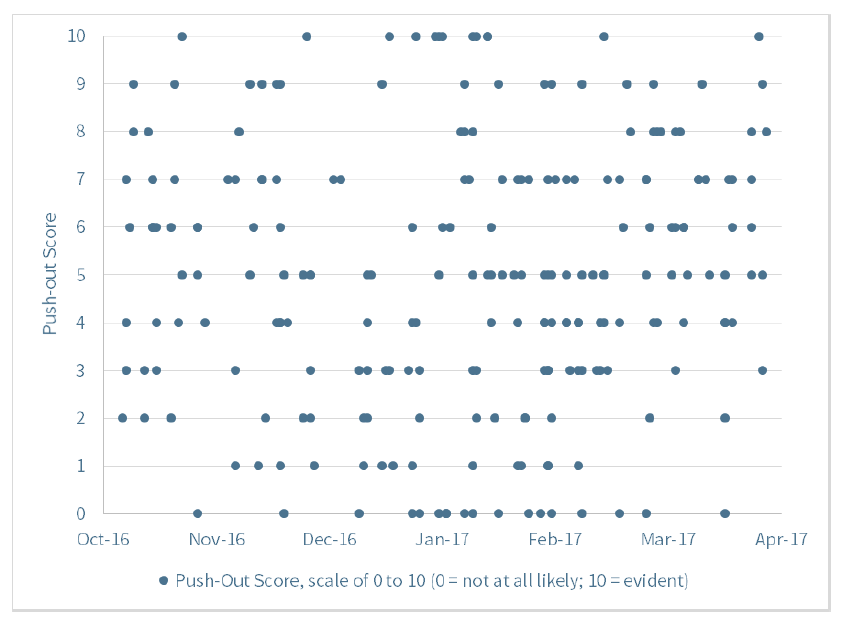
Source: Data from Exechange. Calculations by the authors.
Consider three examples that reflect this ambiguity:
Fluor Corporation. The Exechange model assigns a Push-out Score of 3 (low-to-moderate likelihood of termination) to the resignation of the CFO of Fluor Corporation in March 2017. Red flags include the facts that no explicit reason is given for his departure (he “notified the Corporation that he intends to retire”), the departure is part of a larger management shake-up that also involves the chief operating officer, a permanent successor is not identified (“a search for his replacement is underway”), and the company’s stock price has performed poorly since 2014. However, other factors in the model—such as the form and tone of the press release, his age (63), tenure as CFO (5 years), notice period, etc.—contain no other obvious warning signs. These factors combine to produce a fairly modest Push-out Score of 3.
El Pollo Loco Holdings, Inc. The Exechange model assigns a Push-out Score of 5 (moderate) to the resignation of the CEO of El Pollo Loco in March 2017. Red flags include the brevity of the announcement (five sentences with no explicit words of praise or thanks), no reason given for the departure (“solely due to personal reasons”), poor recent operating performance and negative earnings surprises, a sharp decline in company stock price since 2014, and the fact that no successor is immediately available. The Push-out Score of 5 reflects that determinations of forced termination and voluntary resignation are fairly evenly plausible.
Snyder’s-Lance, Inc. The model assigns a Push-out Score of 8 (high) to the departure of the CEO of Snyder’s-Lance in April 2017. Red flags include the form of the announcement (CEO resignation included in press release with quarterly earnings), the language (brief thanks but no phrases of praise, regret, or good wishes), the outgoing CEO’s young age (57), notice period (CEO departed 6 days before the announcement), poor stock price performance, references to “recent performance challenges”, and the appointment of an interim successor. The only dimension that does not receive a red flag is the outgoing CEO’s tenure (4 years). The Push-out Score of 8 reflects that this CEO is likely, though not certain, to have been terminated.
Individuals can draw their own conclusion about whether the executives in these situations left the company voluntarily. Still, the scaled scoring system allows for a systematic measurement of the observable factors while allowing for the fact that explicit determinations cannot be reached without conclusive evidence.
Finally, it is interesting to consider the relation between Push-out Score and the stock market’s reaction to a CEO or CFO departure. A plot of abnormal stock-price returns (company stock price change minus general stock market change) versus Push-out Score shows that a company’s stock price volatility increases with increasing Push-out Score. That is, investors react in a fairly muted fashion to CEO and CFO departures that receive a low Push-out Score, but react more dramatically—both positively and negatively—as Push-out Score increases (see Exhibit 3).
Exhibit 3 – Push-out Score: Stock Price Reaction to Departure

Source: Push-out Scores from Exechange. Stock prices changes from Yahoo! Finance. Calculations by the authors.
A positive reaction might indicate that shareholders approve of a decision to push out the CEO, because of the potential for operational improvements or future sale of the company. For example, the largest positive reaction in the sample was to oilfield service company Weatherford International’s decision to push out its CEO (Push-out Score of 7), as a 32 percent one-day run up in the stock price reflected investors’ hope that a change in leadership could help stave off bankruptcy. Similarly, shareholders drove up the price of Hertz Global stock by 10 percent following the departure of its CEO (Push-out Score of 9) in anticipation of significant operating changes. These cases might be interpreted as evidence of good governance, as the boards pushed out CEOs who the market wanted gone, but this also raises the question why turnover did not happen sooner.
On the other hand, a negative reaction to a high Push-out Score situation might indicate that shareholders view a forced termination as evidence of deeper operating, financial, or governance problems, or that shareholders disapprove of the decision to fire the CEO. For example, the stock prices of Ralph Lauren CEO (Push-out Score 10) and Tyson Foods (Push-out Score 6) fell by 12 percent and 14 percent, respectively, following news of their CEOs’ resignations. Shareholders of both companies worried that CEO turnover was indicative of deeper-than-expected operating and governance challenges.
Either way, the stock market reaction to a high Push-out Score situation seems to provide evidence on the market’s perception of leadership, oversight, and governance quality.
Why This Matters
- Investors are often unable to tell whether CEO departures are voluntary or involuntary. The Push-out Score developed by Exechange offers a systematic approach for combining observable evidence with expert human judgment to arrive at a reasonable assessment of the likelihood of CEO termination. How accurate is this system? Can Push-out Scores be used to help investors assess governance quality? Can they be used by researchers to more rigorously evaluate the sensitivity of CEO turnover to performance?
- Rather than definitely categorize executive departure as forced or voluntary, the Push-out Score offers a graded score that amounts to a confidence level that a CEO was terminated. What benefits does a graded system have over a strict categorization of voluntary or involuntary turnover? Should companies that receive a “moderate” score take more effort to communicate to investors whether the CEO left voluntarily?
- The data suggest that Push-out Scores are positively correlated with stock market volatility. How should we interpret extremely positive or negative reactions to high Push-out Scores? Are positive reactions indicative of shareholder approval for the termination, or a “vote of no confidence” in the board’s governance prior to the move? Do large negative reactions reflect that the market is learning about issues that it was previously unaware of, or do they reflect that the board is pushing out a CEO that shareholders would rather keep?
The complete paper is available for download here.
Endnotes:
1For example, many press releases state that the CEO “notified the board of their intention to retire,” that the board is “thankful for their service”, and the CEO is “looking forward to spending more time with family.” When a successor is named, both the board and the outgoing CEO tend to express confidence that the successor is “the right person to lead the company going forward.”(go back)
2For a review of the literature on CEO turnover and performance, see: David F. Larcker and Brian Tayan, “CEO Turnover,” Quick Guide Series: Research Spotlight (2016).(go back)
3For more information on Exechange methodology, including examples, see: https://exechange.com.(go back)