 Print
PrintMatthew Goforth is Research Manager at Equilar, Inc. This post is based on an Equilar publication which originally appeared in the Spring 2017 issue of C-Suite magazine, available here. Related research from the Program on Corporate Governance includes: Paying for Long-Term Performance by Lucian Bebchuk and Jesse Fried (discussed on the Forum here).
Since Say on Pay went into effect in 2011, the concept of “pay for performance” has been the foremost trend in executive compensation, both in principle and practice. In response to regulation and pressure from proxy advisors and investors, companies have moved away from discretionary annual bonuses and stock options and toward performance share grants over the last five years.
Public company compensation committees face a number of competing interests, and as a part of the board of directors, they are tasked with determining the amount and structure of the company’s executive compensation program. Recruiting and retaining the most talented executives is their initial focus, and executive pay typically reflects trends in the marketplace. Compensation planning becomes more complicated as boards attempt to adopt a pay philosophy they believe aligns the interests of management and shareholders.
The Evolution of Long-Term Incentives
An effective pay for performance philosophy balances executive incentives with investor return, and leverages the proper means to motivate executives and reward them for performance when it meets expectations. Long-term incentive (LTI) awards serve to balance the short-term goals of the company and its investors with a forward-looking vision, while balancing the risks performance-based pay might introduce for one constituent—management or the owners—more than another.
Following the economic recession and the implementation of Say on Pay, proxy advisory firms that make voting recommendations to shareholders deemed stock options a time-based, rather than a performance-based, award. That isn’t to say stock options have fallen completely out of favor—and in fact a majority of S&P 500 companies still grant them—but the practice of granting them has waned considerably. Five years ago, more than 80% of S&P 500 firms granted stock options, a figure that now includes less than two-thirds of the same companies, according to Equilar data.
In recent years, options have been leveraged more by companies in highly acquisitive and high-growth industry sectors, such as healthcare, where investors are primarily concerned with the capital appreciation of their investment. Moreover, options are not granted as deeply in organizations as they once were, reserved instead for the most senior management roles. In the meantime, compensation committees began awarding more restricted shares, but made them contingent on performance.
As a result of shareholder scrutiny and proxy advisor recommendations, compensation committees began structuring performance-based LTI in a manner that linked awards directly to performance goals set in designated areas. The measures of performance, or metrics, tied to performance-based equity morphed over the last five years as two measures of return came to the fore, according to the recent Equilar report Executive Long-Term Incentive Plans, which featured commentary from E*TRADE Financial Corporate Services, Inc.
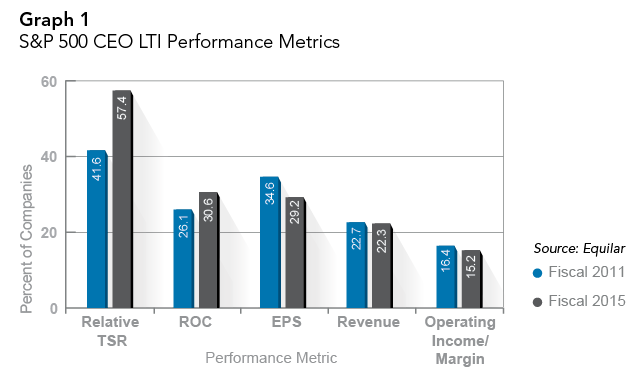
Far and away the most common performance metric, relative total shareholder return (rTSR) is a measure of a company’s stock appreciation and dividend payments relative to a customized group of competitive peers or market index. RTSR was the logical choice for many companies since proxy advisor opinions on pay for performance, and thus their Say on Pay voting recommendations, are largely influenced by a company’s stock performance. This metric also benefits from a simplified goal-setting process, whereby compensation committees need only peg performance goals to a percent ranking within a peer group (in contrast to financial metrics that require a more complex and formal analysis to set firm goals). According to the Equilar report, which covered fiscal years 2011 to 2015, the use of rTSR in LTI awards for CEOs grew from 42% to 57% of S&P 500 companies. (Graph 1)
“Interest in executive alignment with specific performance targets remains a priority. It is often driven by market conditions such as stock price and financial conditions such as return on equity,” noted E*TRADE in its report commentary. “Identifying the right business goals that work to drive executive performance and accountability continues to be a complex challenge for some companies.”
Over the same five-year period, another notable trend emerged. Return on capital (ROC)—which represents the aggregation of return on capital, return on invested capital, return on capital employed, return on investment and return on equity performance metrics—gained prominence. Meanwhile, other measurements like earnings per share (EPS) ceded ground to ROC.
While EPS was more commonly used than ROC in fiscal 2011, roles were reversed four years later. Revenue and operating income were comparatively flat over the same period (Graph 1). From fiscal 2011 to 2015, ROC for CEOs grew from 26.1% of S&P 500 companies to 30.6%. Perhaps not coincidentally, investors have signaled that ROC is a better metric to link executive compensation to company performance compared to rTSR, according to research from Stanford’s Graduate School of Business and Rivel Research Group.
“One reason why we are seeing companies use certain business metrics is that those goals may be more controllable and achievable than a market-related goal that isn’t always within the purview of an executive,” noted E*TRADE.
Striking the Balance in Pay and Performance
Once compensation committees have selected appropriate metrics, the next—and even more complex—step is figuring out how to trigger pay based on performance. Oftentimes, compensation designers will assign multiple metrics to the same award in order to balance performance priorities in one area against another.
“Companies often include more than one metric, allowing them to also track performance based on goals like internal restructuring, product growth or other business line measurements,” wrote E*TRADE.
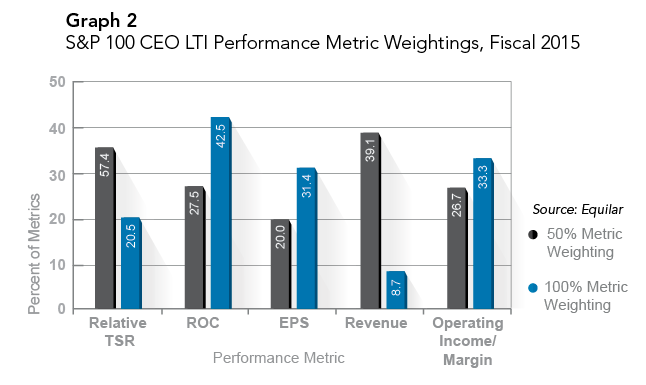
When multiple metrics are linked to the same award, they must be assigned a formal weighting in order to determine the influence of performance in each area. Metric weightings are fairly straightforward to understand. If an award is strictly dependent on one metric, that metric is weighted 100%. If two metrics are used and weighted evenly, then each is assigned a 50% weighting, and so forth. Indeed, the most common metric weightings for LTI awards of S&P 100 CEOs are 50% (rTSR and revenue) and 100% (ROC, EPS and operating income), though weightings are distributed across the spectrum between 0% and 100%. (Graph 2)
Compensation committees may also find more creative ways to include rTSR in their executives’ compensation structure, such as modifying an award’s payout that was originally determined by other weighted metrics. The most common way committees modify LTI awards is to apply a multiplying factor derived from rTSR performance that can adjust the payout downward or upward, according to Equilar data. Strategies to modify awards with rTSR keep management focused on business goals and help alleviate the chances that executives are unfairly rewarded or punished for factors outside their control that affect stock-price performance.
For any given metric, performance targets provide the baseline goal that executives must reach in order to reach their payout. While most awards will allow some payout for underperformance as well as some incentive for surpassing the goal, the magnitudes of these aberrations from target performance typically fall within a narrow range set by thresholds and maximums—i.e., a minimum, or threshold, level of performance below which no payout is merited and a maximum level, setting a cap on the award’s value. This is known as performance leverage. The same process determines target, threshold and maximum payout levels, which are mapped directly to target, threshold and maximum performance goals, respectively.
Threshold payout levels for S&P 100 CEO long-term incentives were most commonly set at 50% of the targeted amount in fiscal 2015. (Graph 3) When threshold payout is 50% of target, it is not possible for the executive to earn between 0% and 50% of the award. The gap from 0% to 50% can serve as a powerful incentive to meet, at a minimum, threshold performance goals. This payout structure diverts from a 0% threshold, where an executive would be eligible to earn even small percentages of the target award once threshold performance is achieved.
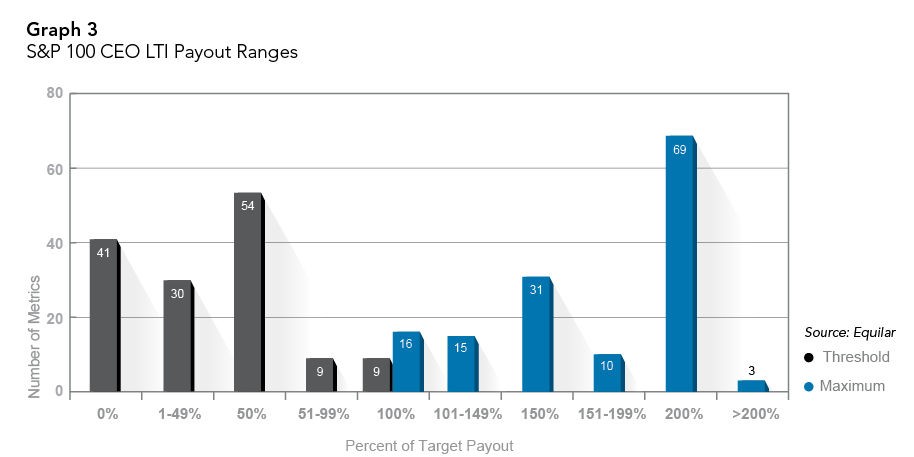
Maximum payouts were not as evenly distributed, and approximately 70% of the metrics identified in the Equilar study were assigned maximum payout at either 150% or 200% of target.
“Very few companies are designing their plans to pay above 200%,” noted E*TRADE, which bears out in the study, where only three metrics exceeded this value.
It’s worth noting that eight metrics in the study were of the “all or nothing” variety, where targeted performance must be met to achieve only one possible payout, with no separate threshold or maximum. (Graph 3)
The growing complexity of long-term incentives means that compensation committees and their advisors face a variable landscape populated by constituents with competing interests. Striking the right balance in LTI award design can reap rewards not only for executives in terms of compensation, but also positive returns for shareholders over a longer-term period.