 Print
PrintRoy Saliba is Executive Director and Head of Global Compensation Products at Institutional Shareholder Services, Inc. This post is based on an ISS publication by Mr. Saliba.
Boards around the world are searching for the “right” performance metrics, and the “right” way to set performance goals. While much of the focus is often on long-term awards, short-term metrics and targets can pose as much or even more of a challenge. Long-term programs are often based on relative performance measures, but short-term programs are more frequently based on absolute measures, and more often than not include earnings measures.
To investors, performance award details, including the choice of metrics, the setting of target goals, and the actual achievement of results provide powerful insights into the board’s performance expectations and how the board motivates management. In designing performance awards, a company’s primary objective is to align shareholder interests with executives, or in other words, pay and performance should be aligned.
Using proprietary data, ISS Incentive Lab evaluates goal achievement and actual performance results for annual incentive awards to gain some insight into the effectiveness of various awards; in other words, how well they correlate with “value creation.” This analysis extends the findings in an earlier ISS publication that was based on initial and limited results for fiscal year 2015.
Annual Incentive Background and Structure
This post provides a review of recent results of award-level payout levels for annual incentives based on actual performance achievement. To understand the drivers behind these payout levels, we analyze goal achievement at the individual metric level with a special focus on earnings metrics.
Annual Awards Constitute a Meaningful Portion of CEO Compensation
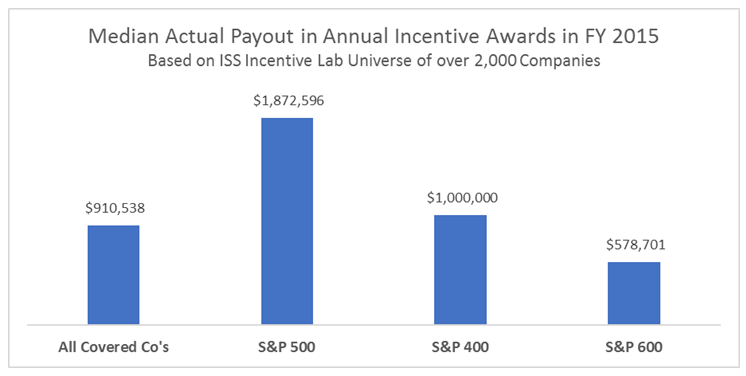
The median actual payout for short-term awards in fiscal year 2015 was just over $910,000 among a group of more than 2,000 companies included in the ISS Incentive Lab database. Of course, those payouts vary based on company size as illustrated below.
Short-term performance awards are designed with threshold, target, and maximum payout levels which can be realized by achieving corresponding performance goals for each of the metrics included in the awards. On average, short-term awards contain about four metrics, which the board sets annually to incentivize executives to achieve financial and non-financial results that support the strategic and operational plans of the business.
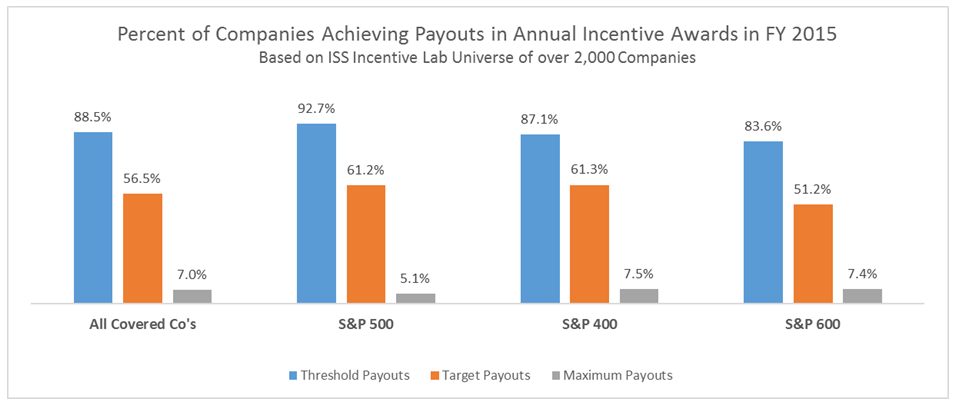
One of the most challenging areas in designing short-term awards is setting the goals—how hard should it be for executives to reach performance that results in target payout, and how should the “guardrails” around threshold and maximum goals be drawn? Most compensation experts agree that as a general rule, threshold goals should be selected so there’s an 80-90 percent probability that they will be met or exceeded, 50-60 percent for target goals, and 10-20 percent probability of achieving maximum goals.
ISS observes actual payout levels for short-term performance awards and finds that the general trends in fiscal year 2015 are consistent with expectations, where 88 percent of companies achieved threshold payouts as defined by their awards, 56 percent achieved target payouts, and while only 7 percent of companies achieved maximum payouts, it is still within the range of expectations. Some differences exist between large-cap, mid-cap, and small-cap companies with S&P 500 companies having the highest achievement rates of threshold payouts and slightly lower achievement rates of maximum payouts, although all indices have achievement rates that are in line with general expectations.
Not All Short-Term Metrics Are Created Equal
The next focus is on goal achievement at the individual metric level, and, specifically, to evaluate if actual payout trends from the overall award level (which generally consist of a combination of metrics) carry through to individual metric performance. To put the most recent results in context, looking at results over the last three years there are consistent trends in 2015 when compared with previous years. Achievement rates for Earnings and Return metrics are five points under 2014 levels, but they still fall within the 50-60 percent range of probability of achieving the target level of performance.

Earnings metrics are the most prevalent performance metrics in annual incentive awards, as detailed in the remainder of this post, but first it is worth highlighting that Cash Flow metrics are the notable exception in these results which consistently have the highest achievement rates over the last three years. Taking a closer look at threshold, target, and maximum goal achievement for Cash Flow metrics, ISS finds that levels are higher than expected across the board and consistent year over year, an indication that perhaps goals are being set lower than where they should be, or that executives have a great degree of freedom to influence the outcome of these short-term goals.

Earnings Metric Goal Achievement, In Aggregate, Generally Meets Expectations
For companies and executives there’s usually a lot on the line for achieving earnings numbers, and ISS finds that reflected in achieving earnings goals when they are a component of the annual incentive plan. A deep dive into goal achievement results for earnings metrics over the last three years is warranted to review prevailing trends and patterns. ISS’ findings indicate that the overall percentage of companies falling into the expected ranges of goal achievement at threshold, target, and maximum.
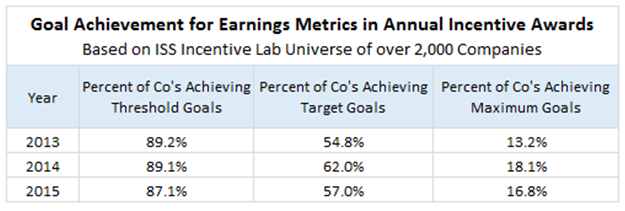
Previous ISS publications have pointed to the claim that Earnings are one of the metrics that executives have the most control over. Through earnings management, academic work suggests that in any one year, about 20 percent of companies actively “manage” earnings, and for those firms 10 percent of the EPS number is typically managed. Even more recent academic work seems to confirm the earnings management phenomenon.
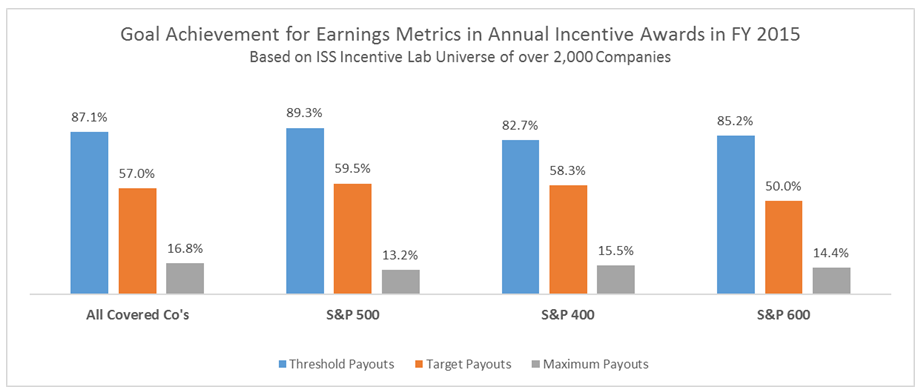
Goal achievement for Earnings metrics is generally consistent across the different indices, in line with expectations, and consistent with overall award payout levels. S&P 500 companies stand out somewhat, when compared with smaller indices, showing the highest Earnings achievement at threshold and target goals, which is not surprising given that Earnings targets at the largest companies are typically the most scrutinized and consistently under the microscope.
Earnings Forecasts and Goals, In Aggregate, Generally Seem Appropriate
Consistent with ISS’ previous analysis, companies are doing a good job of developing forecasts on upcoming earnings numbers and setting target goals that align well with those expectations:
- 60 percent of actual performance results fall within + or −10 percent of the target goal; and
- 40 percent of actual performance results fall within + or −5 percent of the target goal.

Perhaps the most interesting phenomenon is the ability of companies to barely clear the earnings target in their compensation program, where a larger number of companies narrowly beat their target (in the 100 to 105 percent category) over narrowly missing their target (in the 95 to 100 percent category).
Earnings Metrics Called into Question: Target Payout Achievement Doesn’t Mean Positive TSR Results
Industries which are performing well, as measured by the rate at which they achieve their performance goals and positive shareholder returns over the same period as a reflection of financial performance, are expected to exhibit a general consistency between TSR and goal achievement at target. However, when looking at the results in 2015, we observe significant disconnects when we compare target goal achievement for Earnings metrics (generally a driver of share price performance) and median TSR levels for different industries:
- Nine out of 13 industries (69 percent) where median TSR was negative for 2015 had target achievement levels at or above 50 percent (i.e., half of companies achieved their Earnings goals);
- The two worst performing industries on TSR were Energy and Transportation and had goal achievement levels of 52.8 percent and 53.3 percent respectively; and
- The Retailing and Consumer Services industries had exceptionally high goal achievement rates at 67.4 percent and 68.2 percent while both had negative median TSRs of -15.4 percent and -11.5 percent, respectively.
Non-GAAP Earnings Measures Could Be a Significant Contributor
This could be a result of an ever increasing use of non-GAAP or adjusted Earnings metrics in performance plans which could lead to cases where companies achieve their targets in their executive compensation awards but miss the earnings targets that analysts are expecting. This could also be the result of setting a low bar for performance goals in industries that were expected to face headwinds in 2015; actual performance materialized higher than internal expectations but not in line with Street expectations.
In cases where the latter is true, investors should look at how boards and compensation committees approach the goal setting process to ensure there’s general alignment between performance goals and actual performance in coming years.

In summary, ISS’ findings show average performance to be consistent with the intended (Target) performance levels (where achievement ranges between 50 percent and 60 percent), but has observed a wide range of individual performance results, with many companies and industries either overachieving or underachieving targets. As companies complete the goal setting process in coming weeks, investors should consider the company’s approach and its decisions that balance internal (management incentives) and external (shareholders) perspectives when evaluating how changes to performance metrics, goal levels, and target payouts can impact their investments.